Figure 2.
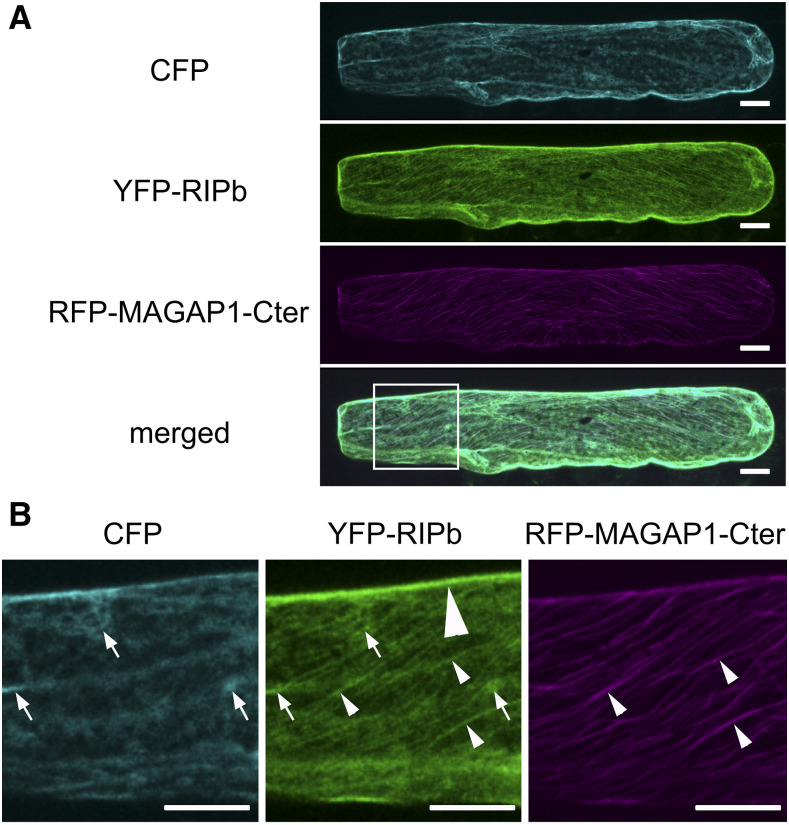
Subcellular localization of RIPb in planta. A, A barley epidermal cell was transiently cotransformed with CFP as a cytosolic marker, YFP-tagged RIPb (YFP-RIPb), and RFP-MAGAP1-Cter as a microtubule marker. Images show z-stacks of optical sections visualized by the confocal laser scanning microscope of the upper half of the cell. Bars = 20 µm. B, Magnification of the part of the cell highlighted in A (merged channel). Please note the YFP-RIPb signal in the cytoplasm (arrows; compare with CFP), at the upper cell periphery (big arrowhead; highlighted only in the YFP-RIPb channel), and at microtubules (long narrow arrowheads; compare with RFP-MAGAP1-Cter). The brightness of the images was equally increased for display purposes. Images show z-stacks of 10 confocal sections of each 2-µm increment. Images represent typical cell recordings of 10 cells per experiment and from three independent transformation experiments with similar results. Bars = 20 µm.

