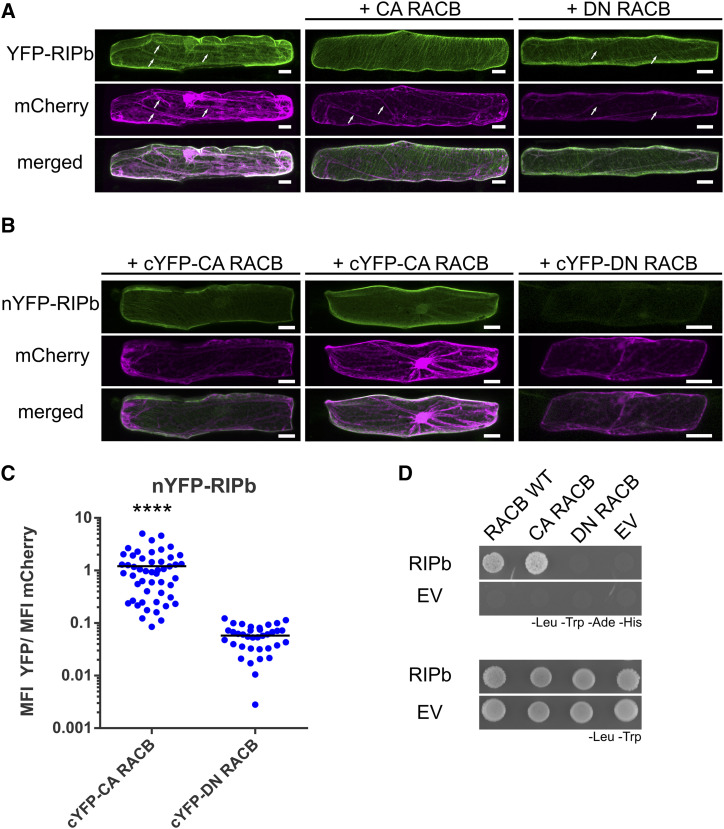
Figure 3.
RACB and RIPb interact in yeast and in planta. A, Single epidermal cells were transiently transformed by particle bombardment. YFP-RIPb and the cytosolic transformation marker mCherry were expressed alone or coexpressed with CA RACB or DN RACB. Images were taken 24 h after bombardment and show representative z-stacks of xy optical sections of the upper half of the cells. White arrows show cytosolic strands. Images represent typical cell recordings of 20 cells per experiment and from three independent transformation experiments with similar results. Bars = 20 µm. B, For BiFC experiments, protein fusions of RIPb, CA RACB, and DN RACB with split-YFP tags were coexpressed. Images were taken 24 h after bombardment. Images show z-stacks of 10 optical sections of the upper half of the cells. Images represent typical cell recordings (n > 30) from two independent transformation experiments with similar results. Bars = 20 µm. C, For the quantification of BiFC experiments, images were taken with constant settings and signal intensity (mean fluorescence intensity [MFI]) was measured over a region of interest at the cell periphery. The ratio between YFP and mCherry fluorescence signals was calculated. The findings shown are from one out of two replicates with similar results. For each replicate, more than 30 cells were measured. ****, P < 0.0001, Student’s t test. D, RIPb was tested in a yeast two-hybrid assay for its interaction with barley wild-type RACB (RACB WT), CA RACB, and DN RACB. As a control, the interaction with the respective empty vectors (EV) was tested. For the identification of interactions, synthetic defined medium lacking Leu (-Leu), Trp (-Trp), adenine (-Ade), and His (-His) was used. For the identification of transformed cells, synthetic dextrose medium lacking Leu and Trp was used.

