Figure 5.
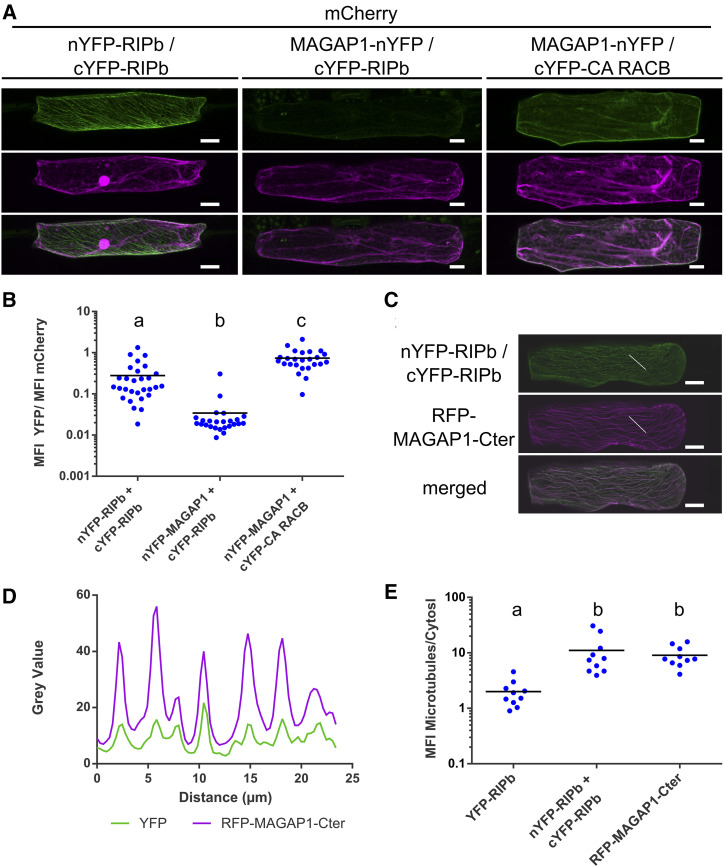
RIPb-RIPb interaction at microtubules. A, Single epidermal cells were transiently transformed by particle bombardment with split-YFP constructs in the combinations nYFP-RIPb and cYFP-RIPb, MAGAP1-nYFP and cYFP-RIPb, as well as MAGAP1-nYFP and cYFP-RIPb. Images represent typical cell recordings of 10 cells per experiment and from three independent transformation experiments with similar results. Images represent z-stacks of 10 confocal sections of each 2-µm increment. B, Quantification of BiFC signals from images were taken with constant settings. Signal intensity (mean fluorescence intensity [MFI]) was measured over a region of interest at the cell periphery. The ratio between split-YFP and free mCherry signal was calculated. Signals were measured in 10 cells for each construct. Letters indicate significance by one-way ANOVA (Tukey’s multiple comparison test; P < 0.05). C and D, Coexpression of nYFP-RIPb and cYFP-RIPb with RFP-MAGAP1-Cter. Image brightness was equally increased for display purposes (C), but signal intensities over a region of interest (white lines) were measured using original data (D). Bars = 20 µm. E, Ratio between the microtubule signal and the cytosolic signal was measured for YFP-RIPb alone, BiFC signal for RIPb-RIPb interaction, and the microtubule marker RFP-MAGAP1-Cter. Letters indicate significance by one-way ANOVA (Tukey’s multiple comparison test; P < 0.05). Microtubule and cytosolic signals were measured at three different regions of interest in the cell. Measurements were made in single optical sections of the z-stack. Note the logarithmic scales.

