
Figure 4.
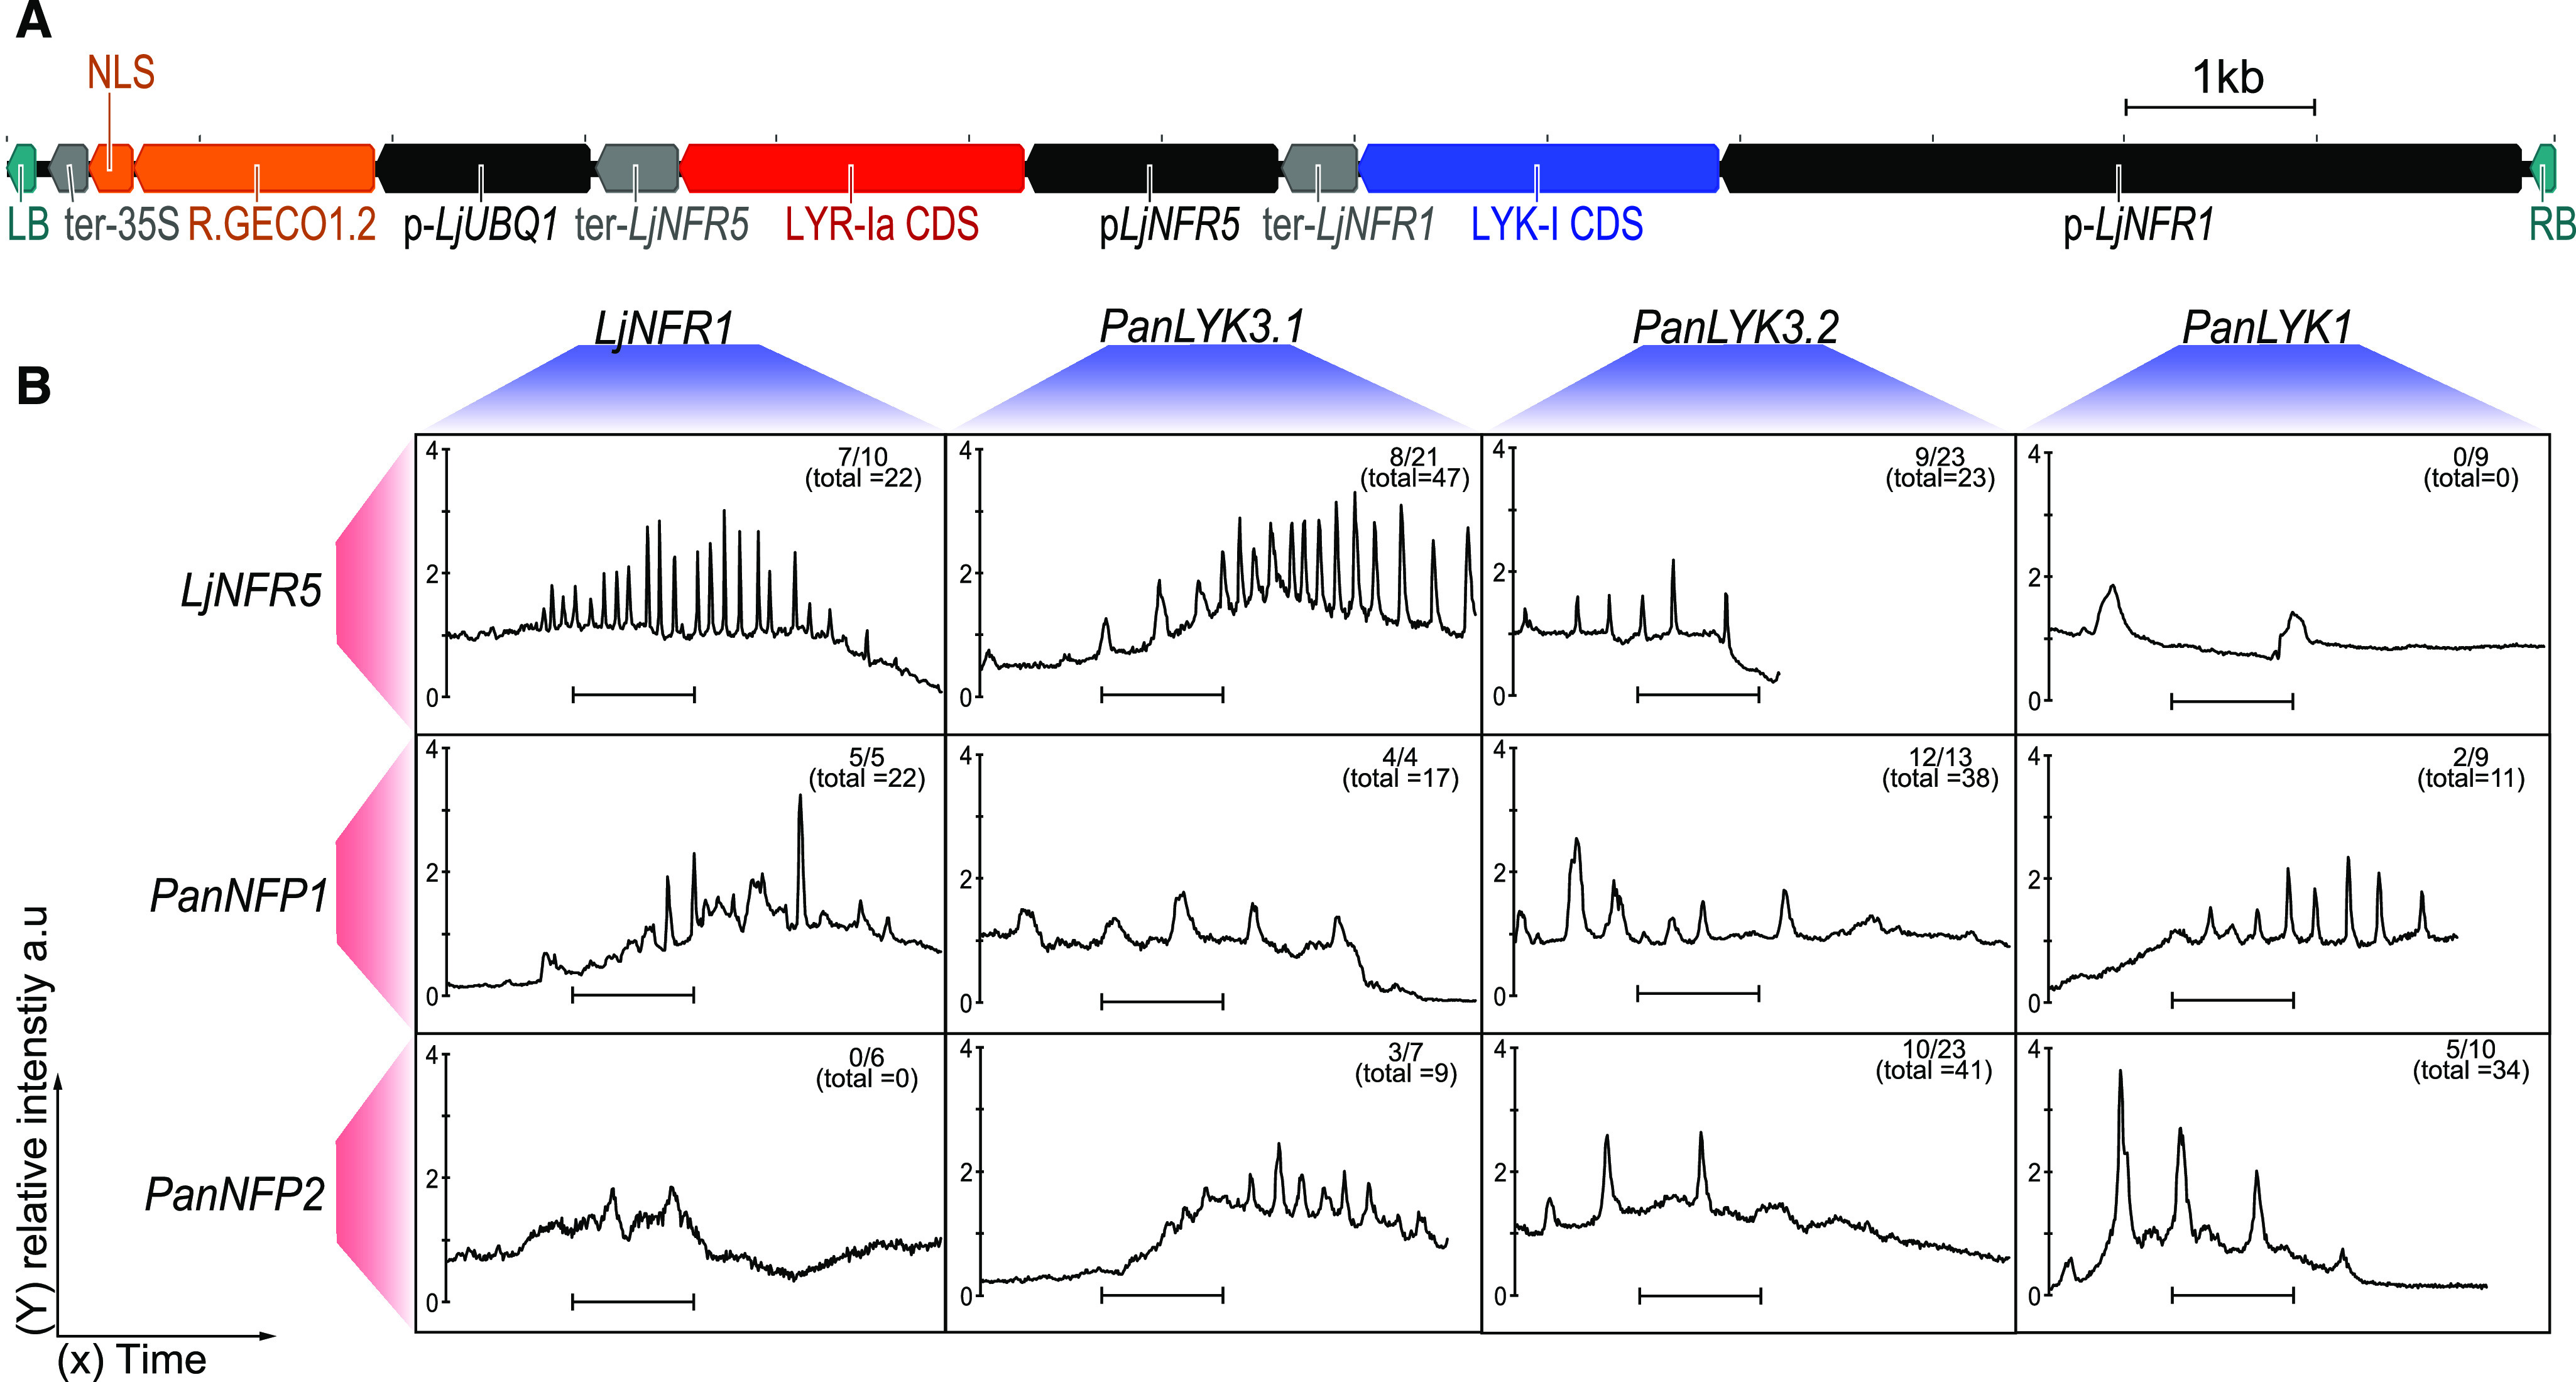
P. andersonii PanNFP1, PanNFP2, PanLYK1, and PanLYK3 complement a L. japonicus Ljnfr1;Ljnfr5 mutant for rhizobium-induced Ca2+ oscillation. A, Schematic representation of the T-DNA region of the binary construct used for A. rhizogenes-based root transformation of a L. japonicus Ljnfr1;Ljnfr5 double mutant. cDNA clones of LYK-I (marked blue) or LYR-Ia (marked red) type genes were cloned in identical fashion. cDNA clones were inserted between native promoter (marked black) pLjNFR1 (4,171 bp) or pLjNFR5 (1,314 bp) and native terminator (marked gray) sequences ter-LjNFR1 (394 bp) or ter-NFR5 (432 bp). pLjUBQ1::R.GECO1.2-nls:CaMV35S-ter (marked orange) was used to visualize nuclear calcium oscillation. The left border (LB) and right border (RB; marked green) flank the T-DNA region. B, Representative traces of nuclear Ca2+ oscillation, as observed in different combinations of LYK-I (red) and LYR-Ia (blue) type receptors introduced in a L. japonicus Ljnfr1;Ljnfr5 double mutant. Note that the receptor combinations PanLYK1;LjNFR5 and LjNFR1;PanNFP2 did not complement for Ca2+ oscillation. Traces were recorded ∼10 min postapplication of LCOs extracted from M. loti R7A (∼10−9 m). Numbers denote spiking roots versus the number of roots analyzed. The numbers in parentheses denote the total numbers of spiking nuclei observed. The y axis is the relative fluorescence intensity compared with the defined baseline in arbitrary units (a.u.). The scale bar = 10 min.