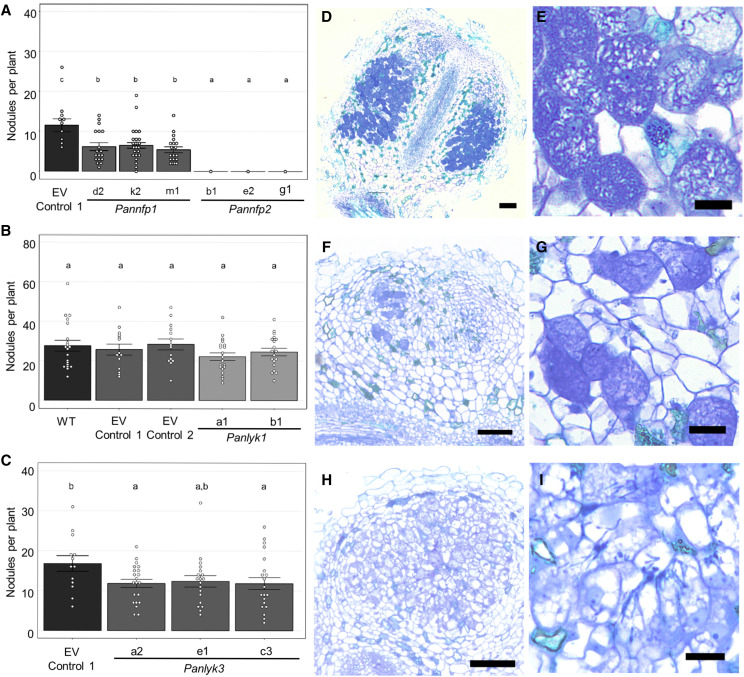
Figure 5.
P. andersonii Pannfp1, Pannfp2, and Panlyk3 mutants are affected in nodulation. Data are represented as means ± se, and circles represent individual data points. Lowercase letters denote statistical significance based on one-way ANOVA and Tukey’s posthoc contrast (P > 0.05). A, Nodule numbers in P. andersonii CRISPR-Cas9 mutant lines Pannfp1 d2 (n = 18), k2 (n = 31), and m1 (n = 19) and Pannfp2 b1 (n = 19), e2 (n = 10), and g1 (n = 9) at 5 wpi with M. plurifarium BOR2. EV Control 1 (n = 12) represents a positive control line transformed with a binary vector not containing sgRNAs. B, Nodule numbers in P. andersonii CRISPR-Cas9 mutant lines Panlyk1 a1 (n = 19) and b1 (n = 20) at 5 wpi with M. plurifarium BOR2. EV Control 1 (n = 14) and EV Control 2 (n = 14) represent two independent positive control lines transformed with a binary vector not containing sgRNAs. WT (n = 20) represents untransformed plantlets. C, Nodule numbers in P. andersonii CRISPR-Cas9 mutant lines Panlyk3 a2 (n = 21), c3 (n = 21), and e1 (n = 19) at 5 wpi with M. plurifarium BOR2. EV Control 1 (n = 14). EV Control 1 represents a positive control line transformed with a binary vector not containing sgRNAs. D to I, Toluidine Blue-stained sections of representative nodules grown with M. plurifarium BOR2. D, Wild-type P. andersonii transformed with an EV-1 construct expressing Cas9. E, Infected nodule cells containing fixation threads formed on EV-1 plants. F, Infected nodule of Panlyk3 line e2. Note patches of infected cells. G, Infected nodule cells of Panlyk3 line e2 containing fixation threads. H, Empty nodule of Panlyk3 line e2. Note the absence of fully infected cells. I, Nodule cells of Panlyk3 line e2 containing infection threads but no fixation threads. Bars = 100 μm (D, F, and H) and 20 μm (E, G, and I).

