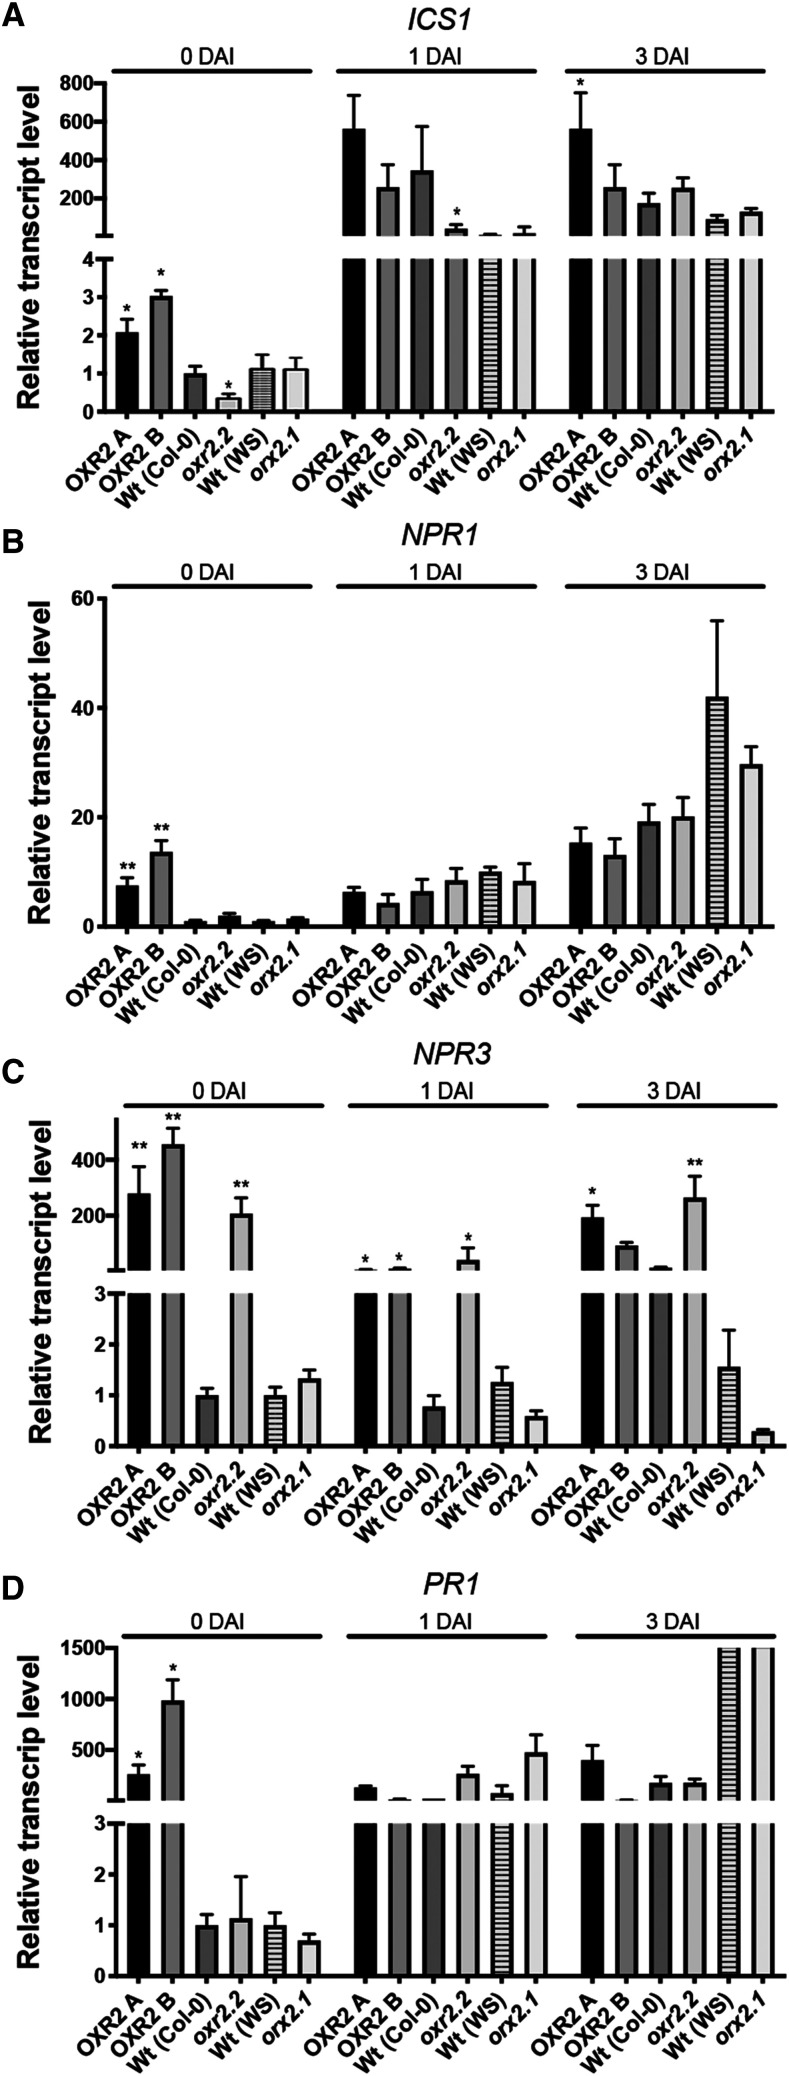
Figure 5.
Molecular analysis of plants with altered AtOXR2 expression during the course of infection with Pst DC3000. Transcript levels of ICS1 (A), NPR1 (B), NPR3 (C), and PR1 (D) were measured by RT-qPCR at different times during the infection. Expression levels are referred to those of wild-type plants of the same ecotype (Col-0 or WS) before the infection (0 DAI). Results are expressed as means ± se. Asterisks indicate significant differences compared with wild-type plants of the same ecotype at the same infection time by ANOVA, lsd Fisher’s test (*P < 0.05 and **P < 0.01).

