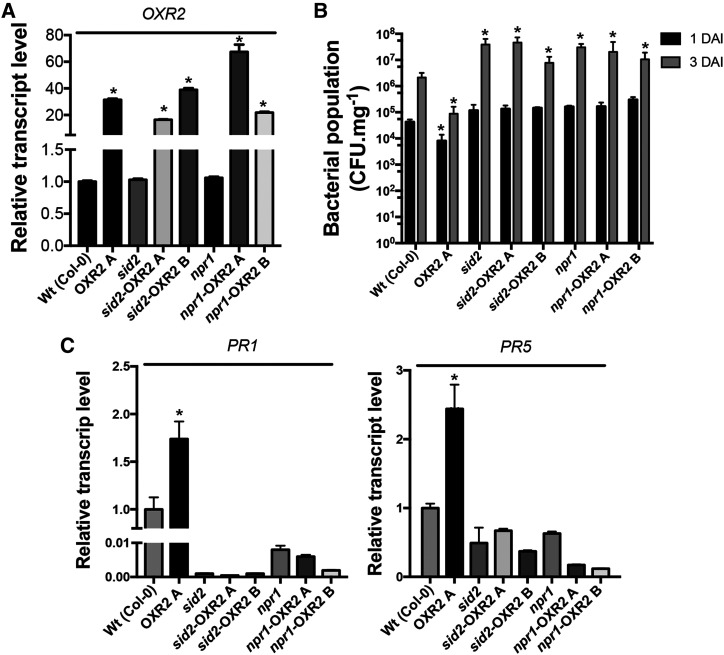
Figure 6.
AtOXR2 acts upstream of SID2 and NPR1. A, AtOXR2 expression levels measured by RT-qPCR in rosette leaves of wild-type (Wt), sid2, and npr1 plants, and the respective transformants obtained in the mutant backgrounds (sid2-OXR2A, sid2-OXR2B, npr1-OXR2A, and npr1-OXR2B). Results are expressed as means ± sd of five independent plants. Asterisks indicate significant differences and are referred to the levels of wild-type plants by ANOVA, lsd Fisher’s test (*P < 0.05). B, The enhanced resistance to Pst DC3000 due to AtOXR2 overexpression is lost in the sid2 and npr1 mutant backgrounds. Two-week-old plants were infected with Pst DC3000, and bacterial populations were quantified at 1 and 3 DAI. Results are expressed as means ± sd of five independent biological replicates. Asterisks indicate significant differences and are referred to the levels of wild-type plants at the correspondent DAI by ANOVA, lsd Fisher’s test (*P < 0.05). C, Analysis of transcript levels of pathogen response genes PR1 and PR5. Expression levels were measured by RT-qPCR in the cDNA samples used in A, prepared from plants before the pathogen infection (basal levels, 0 DAI). Results are expressed as means ± sd of five independent plants. Asterisks indicate significant differences referred to the levels of wild-type plants by ANOVA, lsd Fisher’s test (*P < 0.05).

