Figure 9.
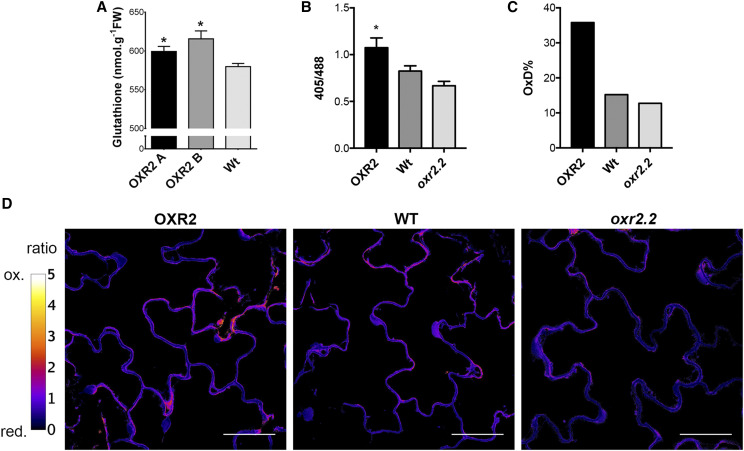
OXR2 plants show increased oxidation of cytosolic Grx1-roGFP2. A, Total GSH levels measured by a spectrophotometric assay on 4-week-old rosette leaves of plants with altered AtOXR2 expression. Values are expressed nanomole per gram fresh weight (FW) and represent means ± sd from five biological replicates. Asterisks indicate significant differences by ANOVA, lsd Fisher’s test (*P < 0.05). Wt, Wild type. B, 405/488 quantitation in 10-d after sowing plants with altered AtOXR2 expression grown in control conditions. Values represent means ± sd from 10 individual plants. The asterisk indicates a significant difference by ANOVA, lsd Fisher’s test (*P < 0.05). C, Degree of roGFP2 oxidation. D, Confocal images showing the 405/488 ratio. The color scale represents the redox state of the fluorescent sensor from the oxidized (ox.; in white) to the reduced (red.; in black) state. Bars = 50 µm.

