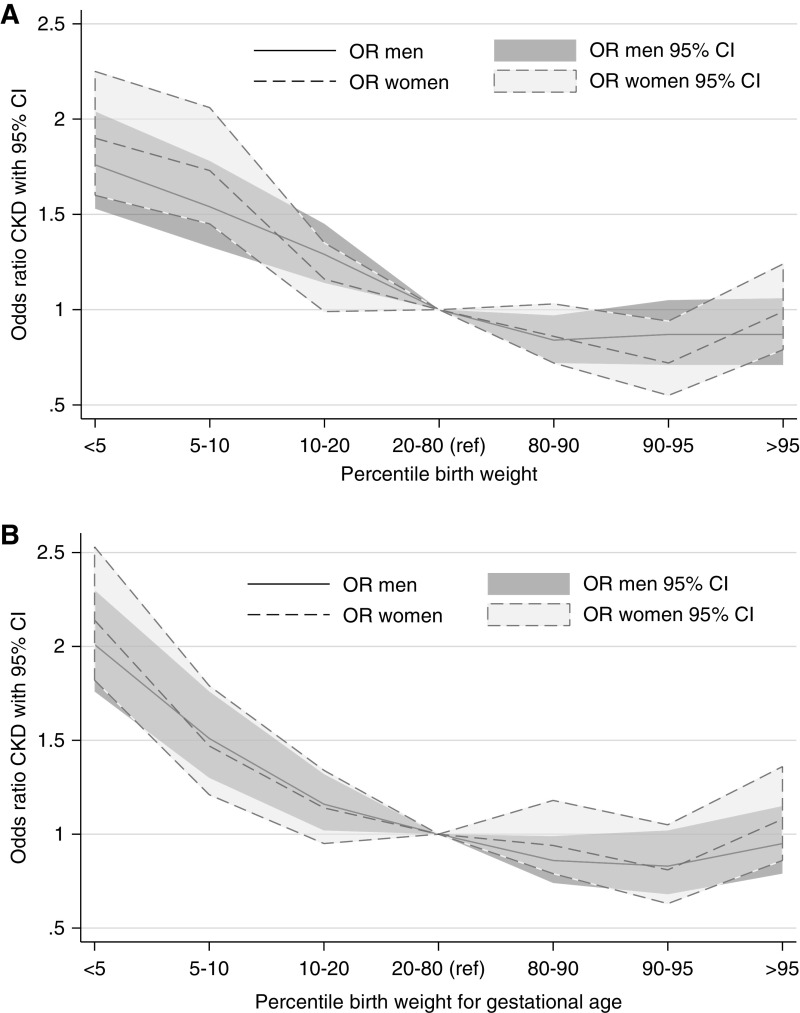
Figure 3.
Odds ratio for CKD according to different percentiles for birth weight (top) and birth weight for gestational age (bottom). Dose-response relationships were observed for both low birth weight and birth weight for gestational age, with higher risks for lower birth weights. Higher risk was seen below the tenth percentile for both LBW and SGA, but significant slightly higher ORs were seen for the tenth to 20th percentile groups for men. 95% CI, 95% confidence interval; OR, odds ratio.

