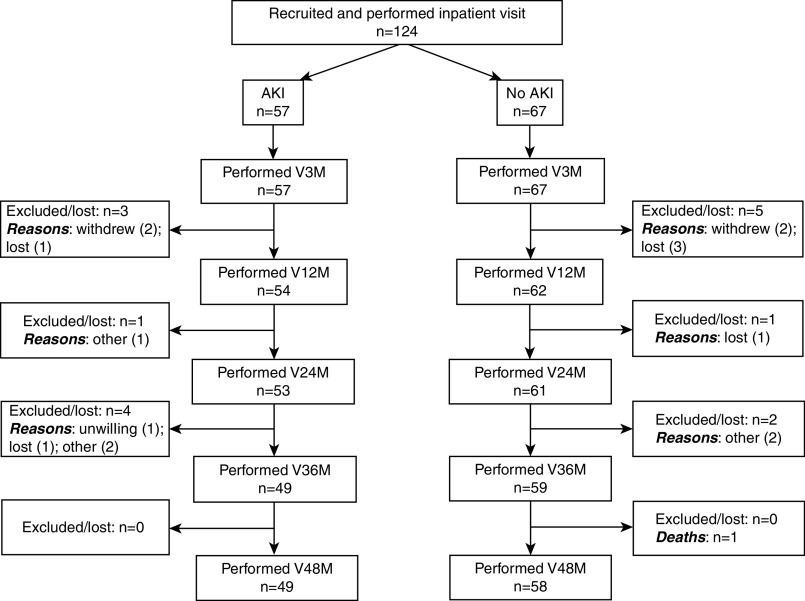
Figure 1.
Flow diagram depicting number of AKI and non-AKI patients between each study visit. The flow diagram displays eligible patients with and without AKI who completed follow-up, in-person study visits. Reasons for exclusions from study visits are shown (“other” refers to inability to perform the visit or invalid visit). The following data are unavailable: (1) total number of potentially eligible patients in preoperative clinics that we were unable to approach; (2) characteristics and number of patients who were not approached for eligibility in preoperative clinics; and (3) number of patients found to be ineligible after screening in preoperative clinics. V3M, 3-month visit; V12M, 12-month visit; V24M, 24-month visit; V36M, 36-month visit; V48M, 48-month visit.

