
Figure 3.
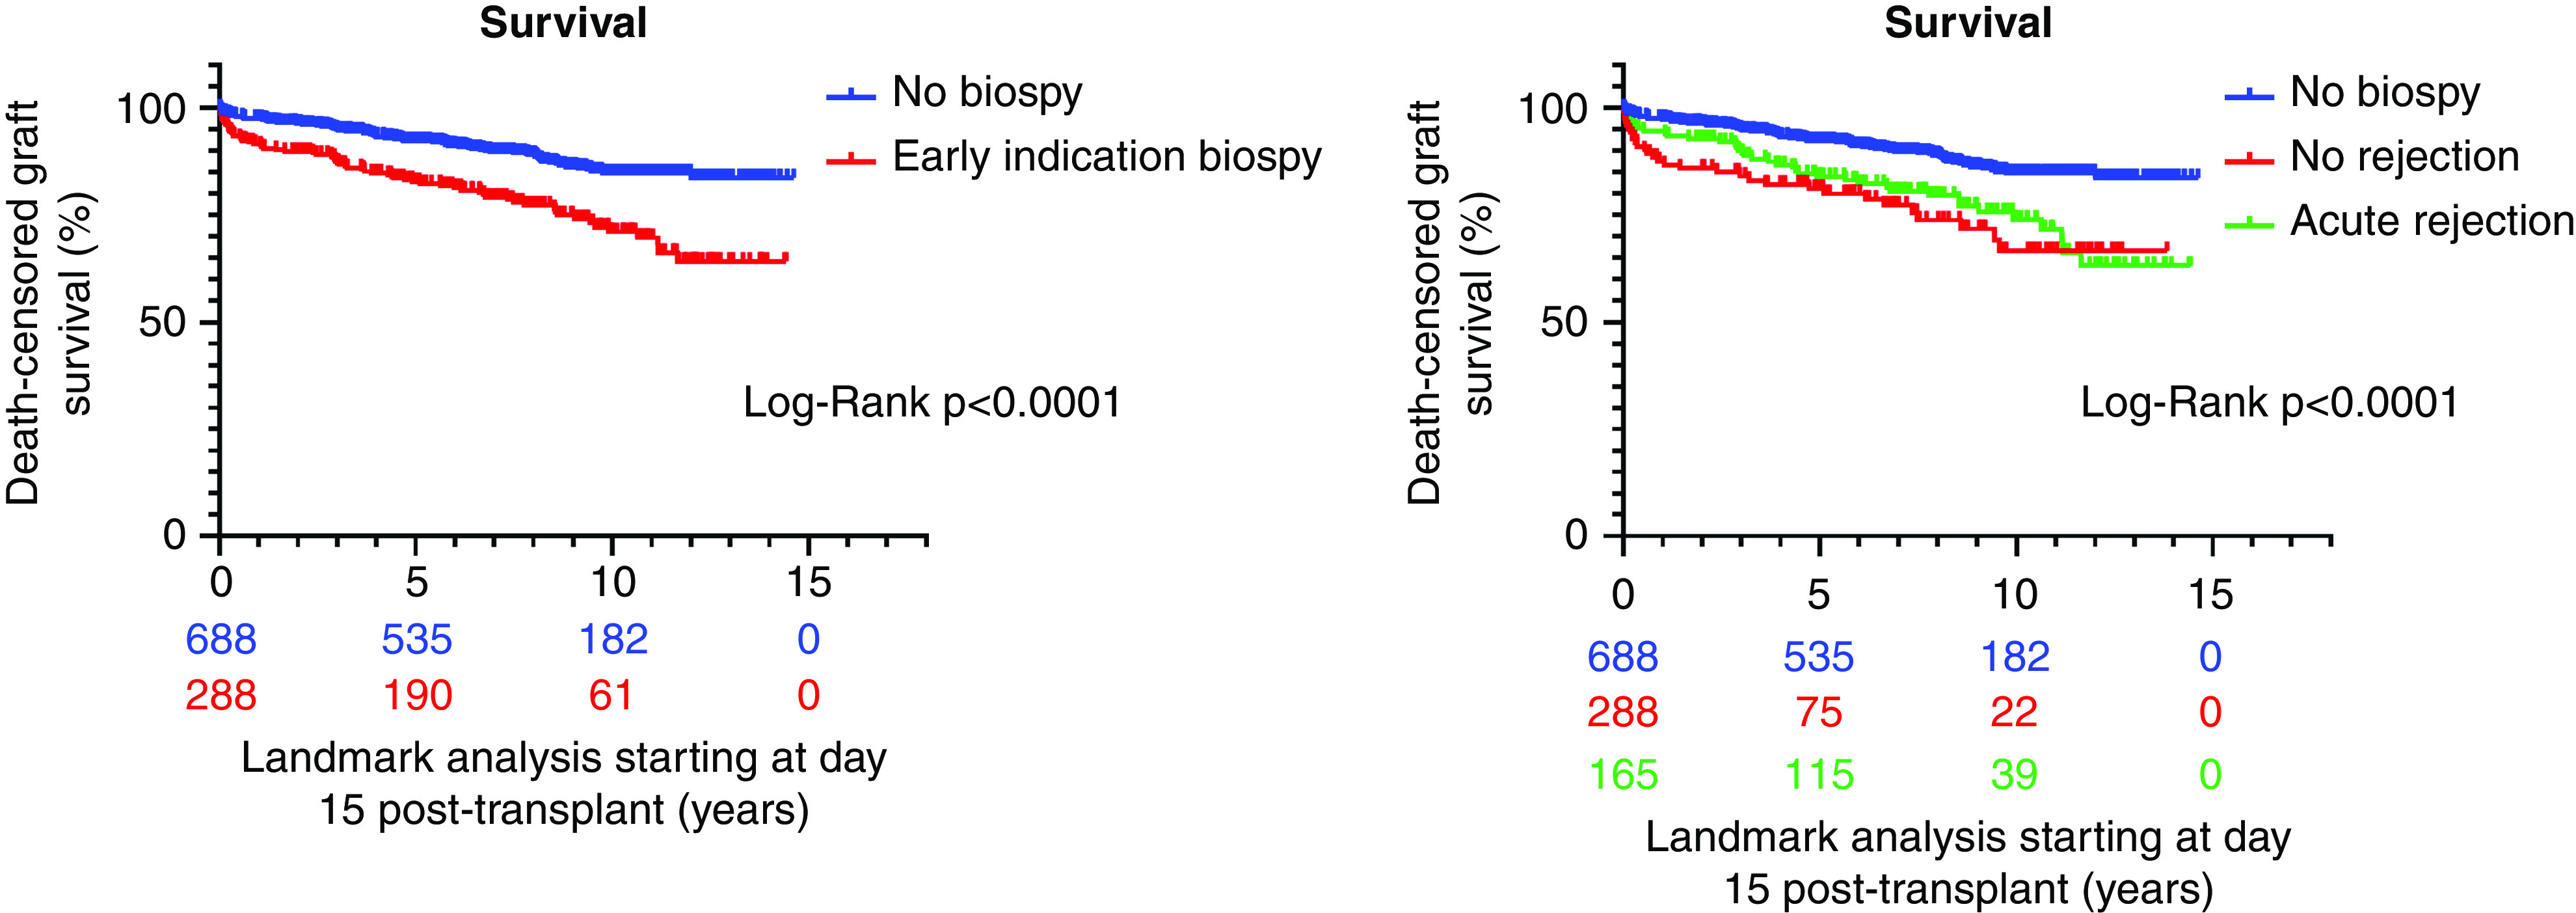
Kaplan–Meier survival curves starting at day 15 after transplantation, stratified according to early indication biopsy in the first 2 weeks after transplantation (left panel), and stratified according to acute rejection in the early biopsy, no rejection in the early biopsy, or no biopsy (right panel). Grafts with an indication biopsy in the first 14 days after transplantation had a worse outcome compared with those without early biopsy; presence or absence of acute rejection in this biopsy made no difference in outcome.