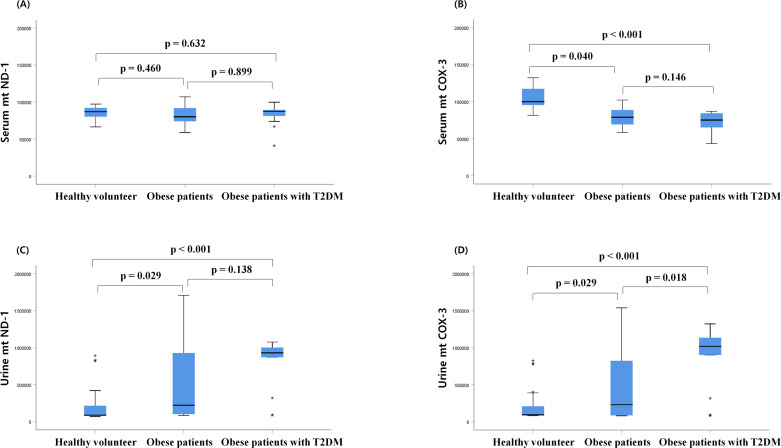
Figure 1.
Comparison of serum and urine mitochondrial DNA (mtDNA) copy number at baseline. (A) Serum mitochondrial nicotinamide adenine dinucleotide dehydrogenase subunit-1 (mtND-1), (B) serum cytochrome-c oxidase 3 (COX-3), (C) urine mtND-1, (D) urine mitochondrial COX-3 (mtCOX-3) in healthy volunteers, patients with obesity and patients with obesity with type 2 diabetes mellitus (T2DM) group at baseline. Box represents first and third quartile and median. Statistical differences between groups were analyzed by analysis of variance followed by Fisher’s LSD test. LSD, least significant difference.

