Figure 4.

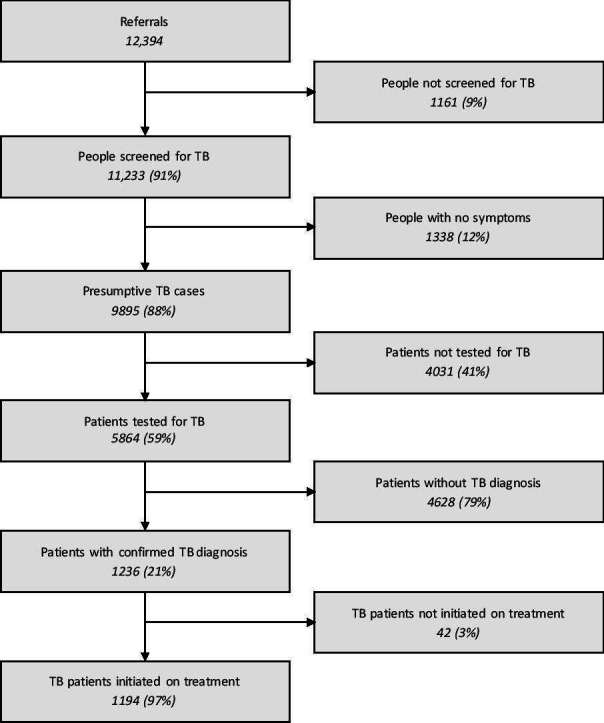
The patient care cascade from Q3 2017 to Q2 2018. *All percentages are calculated as a proportion of the number of participants entering the previous step of the cascade.

The patient care cascade from Q3 2017 to Q2 2018. *All percentages are calculated as a proportion of the number of participants entering the previous step of the cascade.