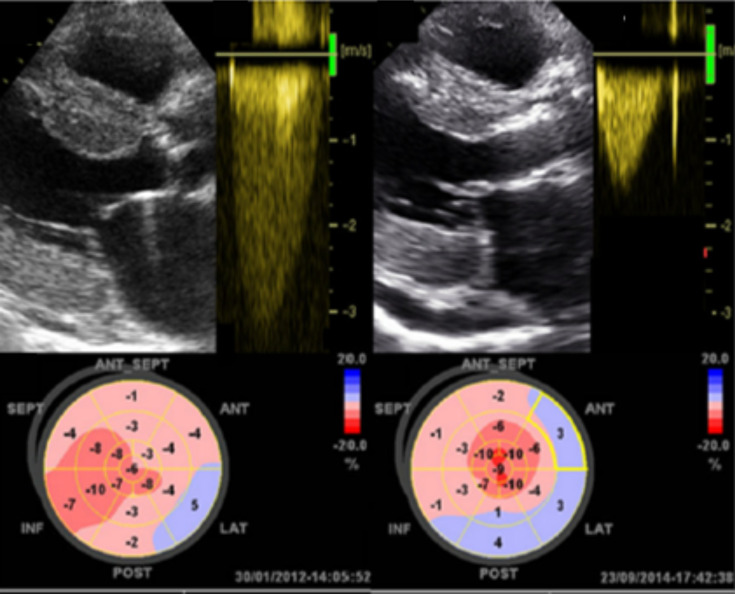
Fig. (3).
This is an example of the low flow low gradient pathophysiology seen in TTR-CA. On the left, echocardiogram shows aortic stenosis, transaortic Doppler shows a low flow low gradient curve, and a global LV longitudinal strain shows severe decrease in LV contractibility. On the right, the same patient 33 months post-TAVR showing improved aortic gradient and slight decrease in LV contractility. Castano et al. (A higher resolution / colour version of this figure is available in the electronic copy of the article).

