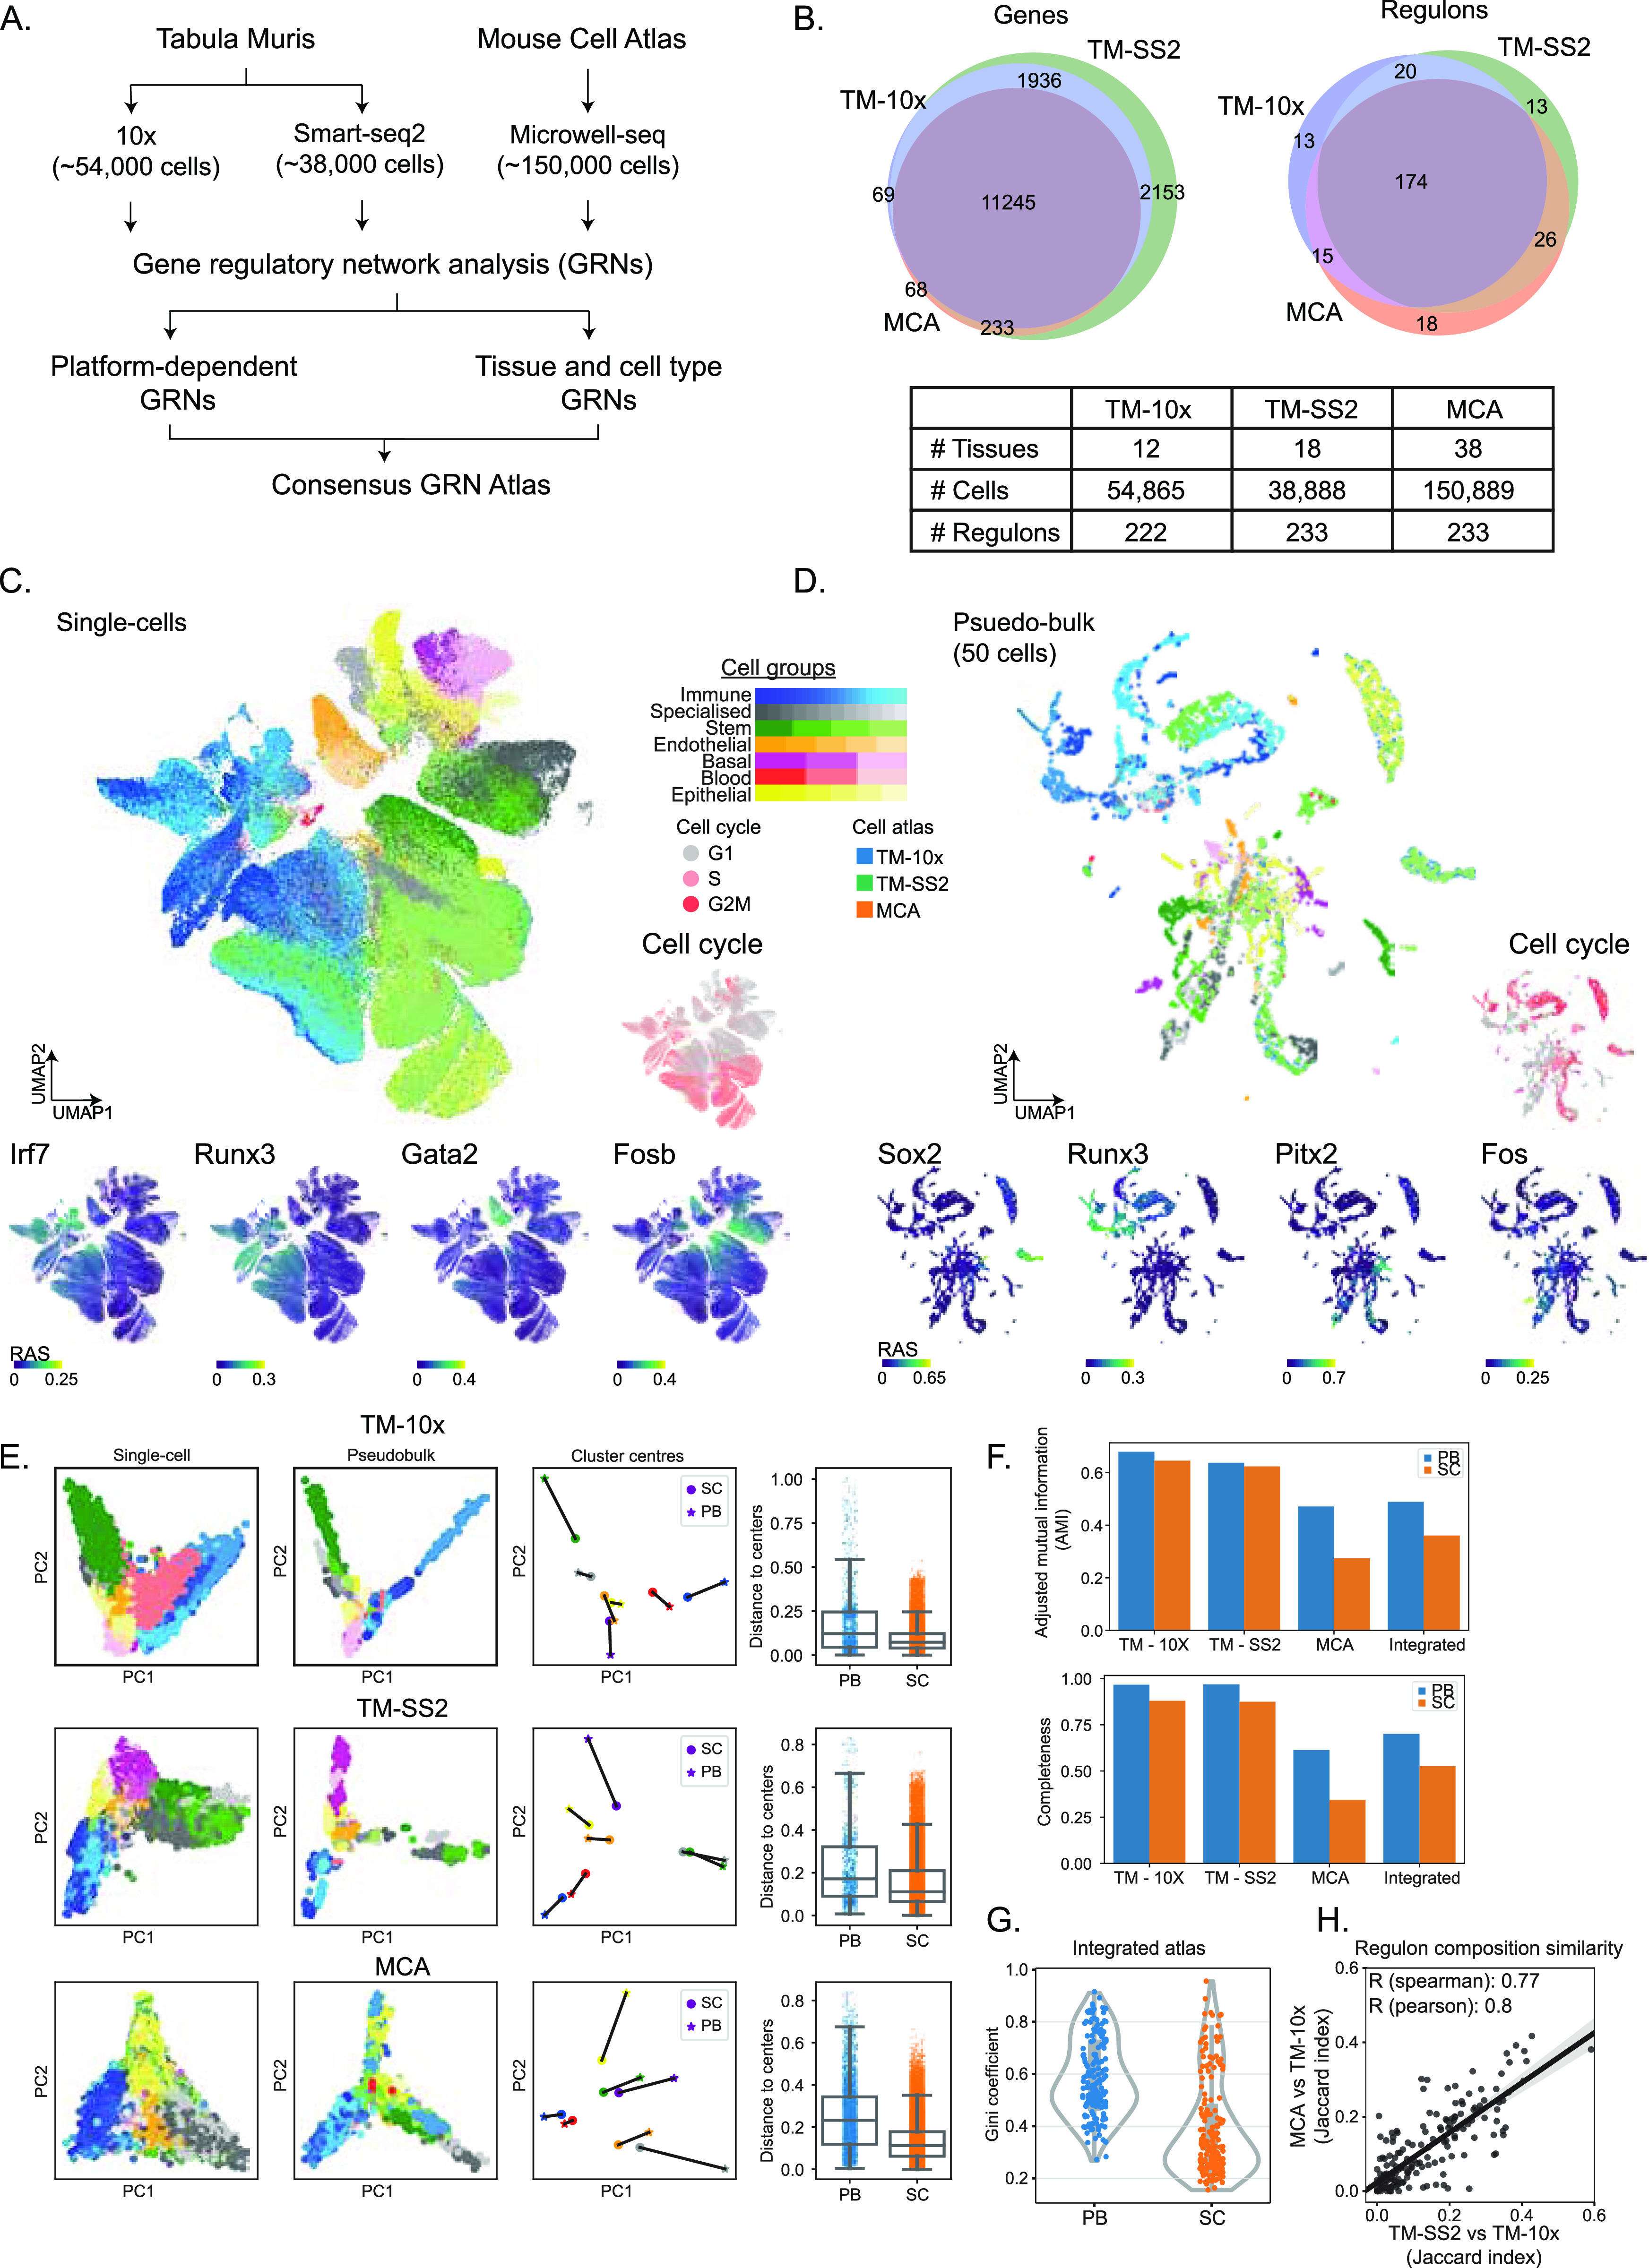
Figure 1.

Gene regulatory inference from integrated single-cell transcriptomic atlases. (A) Overview of datasets and analysis performed in this study. (B) Venn plots and table representation of shared and unique features across cell atlases including tissues, number of cells, and regulons across cells. We used 11,245 overlapping genes and resulting 279 unique regulons for regulatory analysis. (C) UMAP embedding of single cells (centre) based on regulon activity scores (RAS) from integrated mouse atlases. The individual cells are coloured by 55 reference cell types corresponding to seven cell groups. The surrounding plots highlight examples of individual regulons (Irf7, Runx3, Gata2, and Fosb) coloured by RAS, predicted cell cycle stages (right), and overlaid on UMAP. (D) UMAP embedding of 50-cell pseudobulk samples, based on RAS from integrated mouse atlases. The surrounding plots highlight examples of individual regulons (Sox2, Runx3, Pitx2, and Fos) coloured by RAS, predicted cell cycle stages (right), and overlaid on UMAP. The pseudobulk is generated by averaging the expression of 50 cells across same tissues, using author assigned tissue and cell type labels; and performing SCENIC regulon inference. (E) Principal component analysis of matched single- and pseudobulk cells based on RAS across individual atlases and coloured by seven cell groups (first two columns). For each of the seven cell groups, we plot cluster centroids (column 3) and connect single- (circles) and pseudobulk (asterisk). Box plots (column 4) represent Euclidean distance of individual single- and pseudobulk cells to respective cell group centroid. (F) Different measures of cluster comparison (top: adjusted mutual information, bottom: completeness) between pseudobulk and single cells across integrated and individual mouse atlases, considering seven cell groups. (G) Distribution of Gini coefficients per regulon in pseudobulk and single cells across integrated atlas, considering all seven cell groups. The Gini coefficient is a measure of inequality, that is, whether individual regulons contribute to individual (smaller Gini) or multiple cell groups (higher Gini). The pseudobulk cells have higher Gini coefficients and tighter distributions compared with single cells, which highlights their contribution to effectively distinguish multiple cell groups. (H) Comparison of regulon composition between atlases (pairwise Jaccard index) considering TM-10× as reference. Each dot represents a regulon and overlap of its target genes across three atlases. The shaded area represents 95% confidence interval from the linear regression line.
