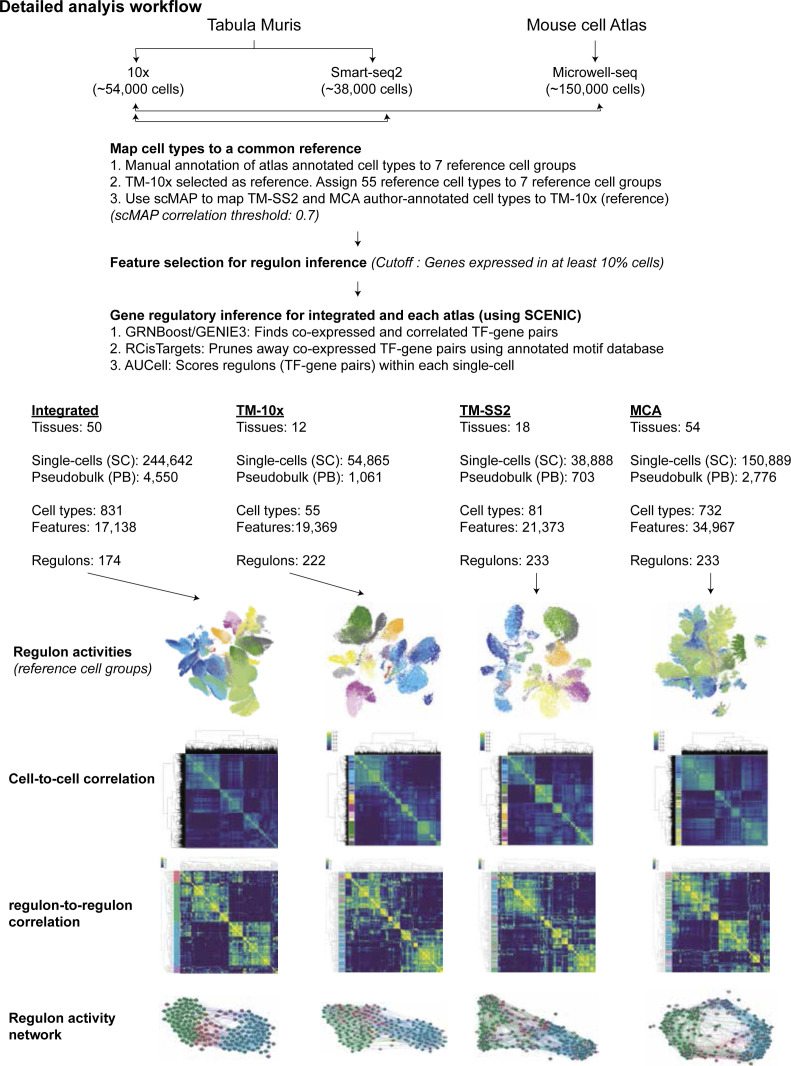
Figure S1. Detailed workflow of atlas-scale gene regulatory network analysis.
To effectively integrate single-cell annotations across three atlases, we first manually devised seven reference cell groups, chose TM-10× as a common reference and assigned the 55 cell types to seven cell groups, respectively. Next, we used scMAP to link each atlas (TM-SS2 and Mouse Cell Atlas) to the reference and built an integrated mouse atlas with common vocabulary for all single cells. Using a stringent feature selection cutoff, we performed gene regulatory network inference using SCENIC. This briefly includes transcription factor (TF) and TF-target identification from single-cell expression matrices (GRNBoost), cross-validation of TF and its direct targets (i.e., Regulons) using annotated motif databases and pruning away indirect, co-expressed genes (RCisTarget) and at last scoring the regulon activity (RAS, regulon activity score) within each single cell. We applied the framework to integrated and individual atlases to (i) classify individual and pseudobulk cells based global regulon activity (UMAP), (ii) classify cells based on shared and distinct regulon activity (cell-to-cell correlation), (iii) identify consensus and cell group specific regulons (regulon-to-regulon correlation), and (iv) build an atlas-scale regulon activity network.

