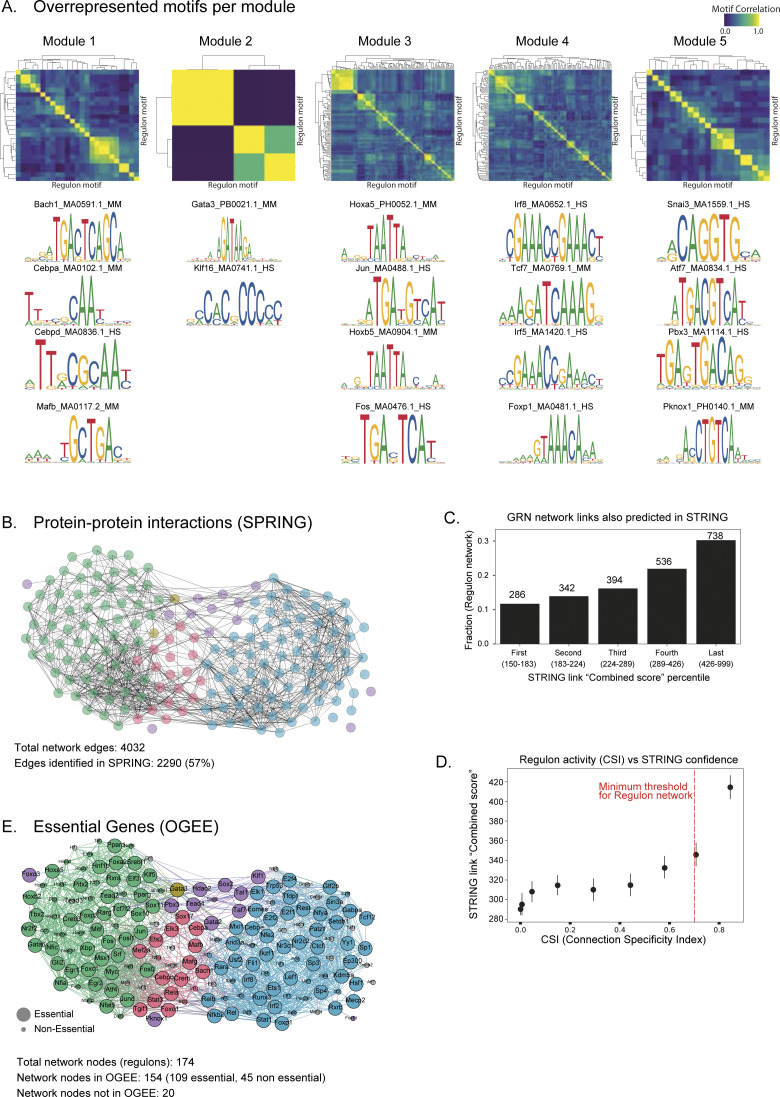
Figure S17. Validation of regulon network.
(A) Top: Motif correlation between individual regulons within each module. The rows and columns indicate individual motif sequences of different lengths. Bottom: representative examples of transcription factors and their enriched motifs for each regulon module. (B) Annotated protein–protein interactions from STRING overlaid on integrated regulon network. STRING contains all regulons (nodes), and only STRING validated interactions (black edges) are highlighted in the regulon network. 57% of regulon network edges are validated by STRING. (C) Distribution of the STRING validated interactions captured in the regulon network, plotted across 20 percentile combined score bins (x-axis). The number of regulon network links is listed above individual bins. The combined score is a measure of confidence of STRING protein–protein interaction. (D) Correlation between regulon Connection Specific Index and STRING confidence score. The error bars represent the 95% confidence interval. Red line indicates the connection specific index threshold used to construct the regulon network. (E) Regulon network overlaid with experimentally validated and essential genes (OGEE essentiality status). The enlarged nodes represent essential genes, whereas diminished nodes are annotated as non-essential. The regulons absent in OGEE are shown in “grey.”

