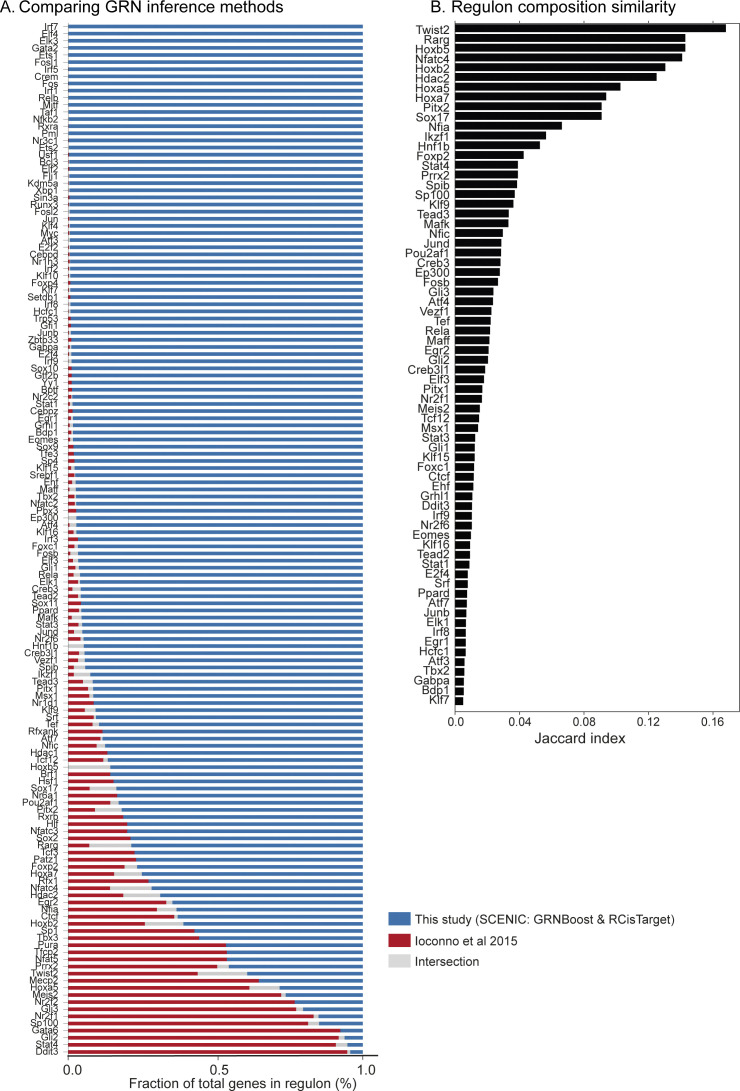
Figure S21. Comparing different gene regulatory network methods for atlas-scale analysis.
(A) Overlap of regulons and target genes identified in this study (SCENIC: GRNBoost and RCisTarget) and repeating analysis with published gene regulatory network method (bigSCale2 (41)) for TM-10× mouse atlas. (B) Jaccard index highlighting the overlap between regulon composition inferred on TM-10× atlas by our framework and repeating analysis with bigSCale2. For simplicity, we visualise regulons with Jaccard similarity scores above 0.005.

