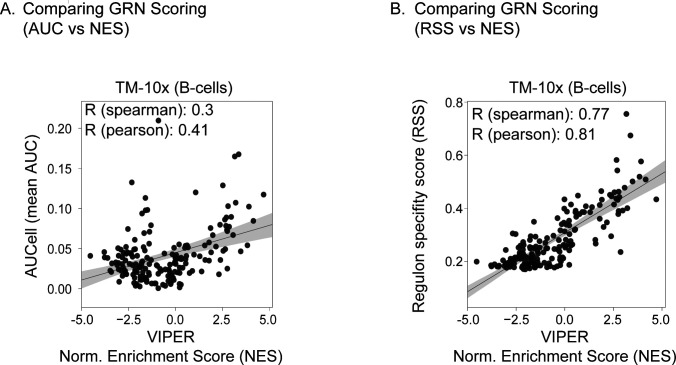
Figure S22. Comparing different gene regulatory network scoring methods.
(A) Correlation between AUCell and VIPER scoring of regulons across B-cells from TM-10× atlas. For each regulon, x-axis represents the area under the curve (AUC) computed by AUCell, whereas the y-axis represents normalised enrichment score computed by VIPER. (B) Correlation between regulon specificity score and normalised enrichment score (VIPER) for each regulon across B-cells from TM-10× atlas. Each dot represents a regulon and the shaded area represents 95% confidence interval from the linear regression line.

