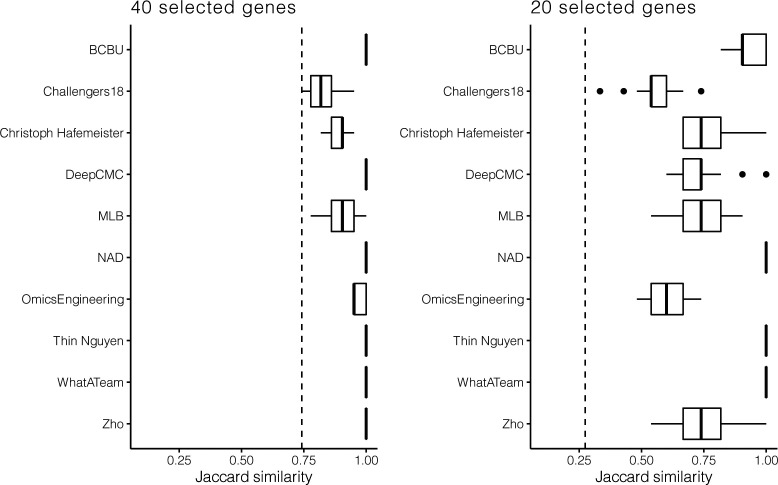
Figure S10. Boxplots of the Jaccard similarity between the genes selected for each fold in the 10 cross-validation scheme for the selection of 40 and 20 genes from the zebra fish embryo dataset.
Dotted line represents the limit for significance, that is, the expected Jaccard similarity between two sets of randomly selected 40 or 20 genes.

