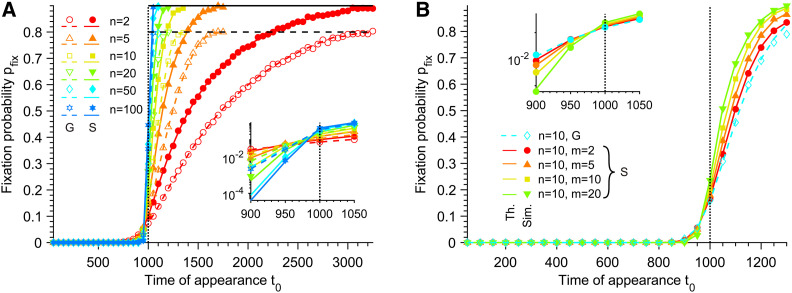
Figure 2.
Fixation probability of mutants. (A) Fixation probability pfix of G and S mutants vs. their time of appearance t0 in the deteriorating environment, for different Hill coefficients n characterizing the steepness of the environment deterioration (see Equation 1). Here, S mutants satisfy m = n, i.e., they have the same sensitivity to the environment as W organisms (see Equation 2). Horizontal dashed line: Horizontal solid line: Data are shown for t0 < τW, where τW is the average extinction time of the W population in the absence of mutation. (B) Fixation probability pfix of different types of mutants vs. their time of appearance t0 in the deteriorating environment, for a fixed Hill coefficient n = 10 characterizing the decay of fW (see Equation 1). G mutants and S mutants with different Hill coefficients m (see Equation 2), corresponding to different sensitivities to the changing environment, are considered. In both panels, markers correspond to averages over 104 replicate stochastic simulations (“Sim.”). Dashed and solid lines correspond to numerical integrations of Equation 4 (“Th.”) for G and S mutants, respectively. Parameter values: K = 103, and θ = 103. Vertical dotted lines: t0 = θ. Main panels: linear scale; insets: semilogarithmic scale.

