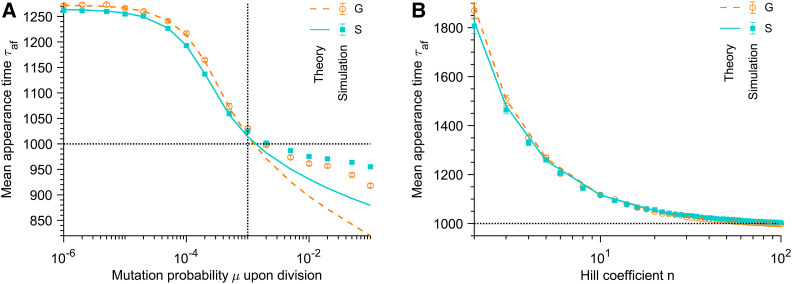
Figure 4.
Time of appearance of the mutants that fix. (A) Average time τaf of appearance of a G or S mutant that fixes vs. mutation probability μ upon division. The Hill coefficient characterizing the steepness of the environment deterioration (see Equation 1) is n = 5. Vertical dotted line: Kμ = 1. (B) Average time τaf of appearance of a G or S mutant that fixes vs. Hill coefficient n. The mutation probability upon division is μ = 10−5. In both panels, markers correspond to averages over 103–104 replicate stochastic simulations (“Simulation”). Dashed and solid lines correspond to numerical integrations of Equation 13 (“Theory”) for G and S mutants, respectively. Parameter values: K = 103, and θ = 103. Horizontal dotted lines: τaf = θ.

