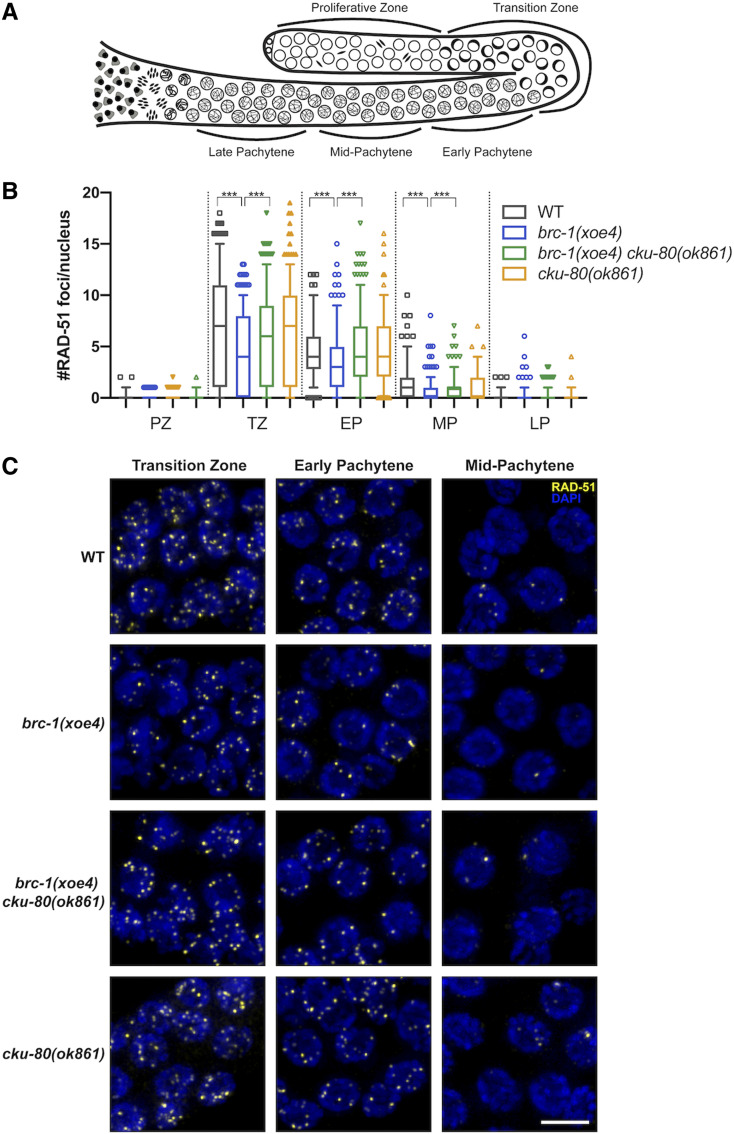
Figure 2.
BRC-1-BRD-1 promotes HR at the expense of NHEJ in the male germ line. (A) Cartoon of the spatiotemporal organization of the C. elegans male germ line, modified from Van et al. (2016). (B) Quantification of RAD-51 in indicated regions of the germ line. Box whisker plots show number of RAD-51 foci per nucleus in the different regions. Horizontal line of each box represents the median, top and bottom of each box represents medians of upper and lower quartiles, lines extending above and below boxes indicate SD, and individual data points are outliers from 5 to 95%. Statistical comparisons by Mann–Whitney of WT vs. brc-1(xoe4) and brc-1(xoe4) vs. brc-1(xoe4) cku-80(ok861) in the different regions of the germ line; ***P < 0.0001. All statistical comparisons are shown in Table S3. PZ, proliferative zone; TZ, transition zone; EP, early pachytene; MP, mid-pachytene; LP, late pachytene. Number of germ lines and nuclei scored in each region: WT = 6, PZ = 958; TZ = 413; EP = 266; MP = 252; LP = 219; brc-1(xoe4) = 6, PZ = 848; TZ = 343; EP = 320; MP = 330; LP = 287; brc-1(xoe4) cku-80(ok861) = 6, PZ = 905; TZ = 316; EP = 296; MP = 329; LP = 289; cku-80(ok861) = 4, PZ = 814; TZ = 287; EP = 202; MP = 230; LP = 217. (C) Representative images of nuclei from indicated genotypes and regions of the germ line stained with antibodies against RAD-51 (yellow) and counterstained with DAPI (blue). Images are projections through half of the gonad. Bar, 5 μm.

