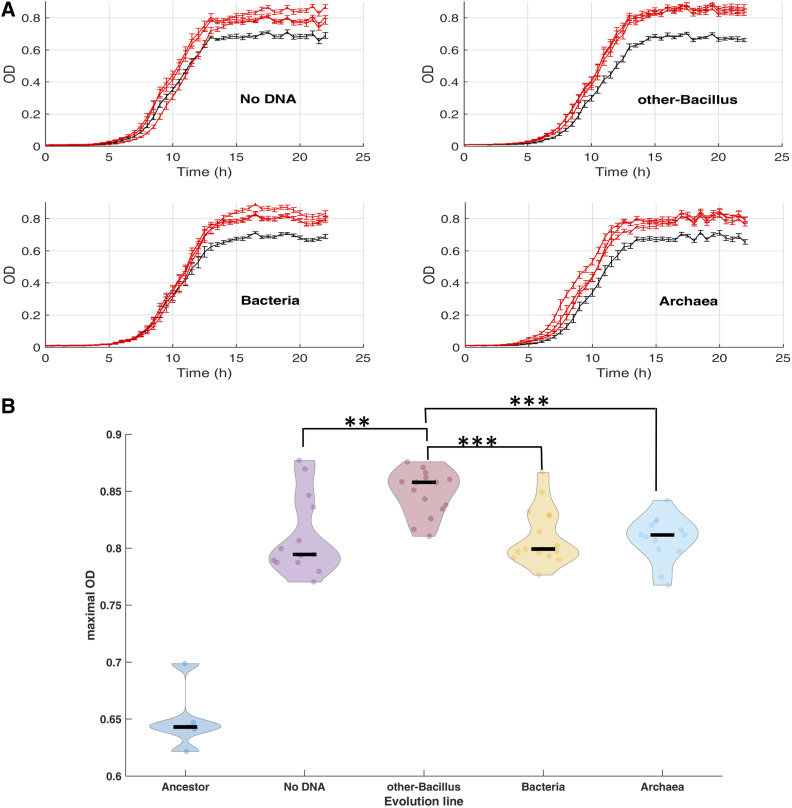
Figure 2.
Growth measurements of the evolved lines. (A) Growth measurements of each of the evolution lines (red) compared to the ancestor (gray). Following 504 generations of evolution, the growth of each population, as well as the ancestor, on high salinity media was measured. Each subplot presents the change in optical density (OD) as a function of time. For simplicity, only one growth experiment out of five biological replicates is shown. (B) Maximal OD values (y axis) were extracted from several growth experiments using the curveball algorithm (Ram et al. 2019). The violin plots present the distribution of curveball-derived maximal OD values for the ancestor as well as each of the four experiment types (grouping together all three evolutionary lines, each measured in three to five independent growth experiments). Black lines indicate median values (median, mean, and SD values can be found in Table S1). Statistically significant pairwise comparisons (rank sum tests) between other-Bacillus populations and each of the three additional populations is shown. **P-value < 0.01 ***P-value < 0.001. Comparisons between all other pairs of evolutionary populations were found to be not significant.

