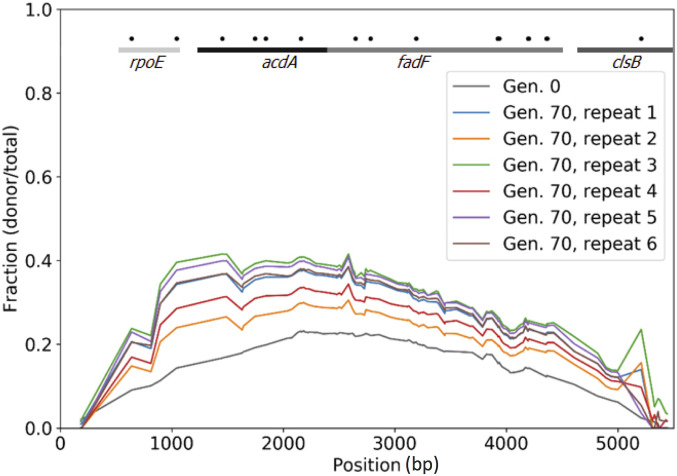
Figure 4.
Acquisition of an HGT fragment provides a fitness advantage under similar conditions to those used for the experimental evolution experiment. Results of six competition assay replicates (70 generations) of a library of transformed B. subtilis 168 competent cells, containing different or no regions of a 5.6 kb DNA fragment from B. subtilis strain RS-D-2. The graph portrays the frequency of each mismatch along the fragment before and after the competition as calculated based on deep sequencing. The frequency of each mismatch at generation 0 (immediately after transformation) and in generation 70 is presented on the y-axis. The mismatch location along the fragment is presented on the x-axis. The lines and gene names at the top of the figure denote the genes located in the corresponding regions in the B. subtilis 168 genome. Black dots denote mismatches that result in nonsynonymous substitutions.

