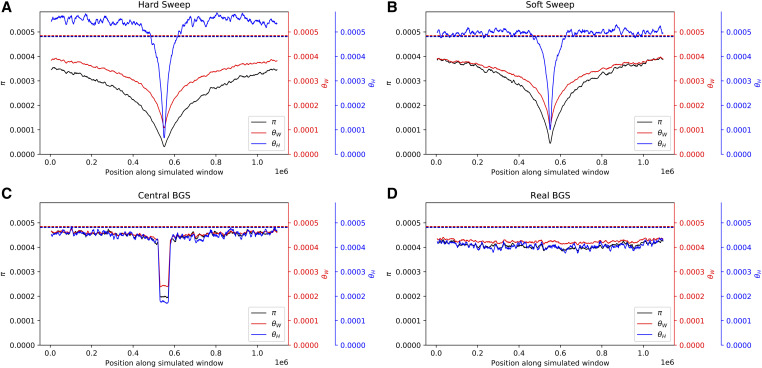
Figure 2.
Patterns of diversity produced by different models of linked selection under constant population size. (A) Values of three estimators of θ in regions experiencing a recent hard sweep at the center of the window. (B) Values of these estimators in regions with a recent soft sweep at the center. (C) Values in regions where purifying selection is acting on a central 50-kb element. (D) Values in regions with purifying selection acting on elements distributed across the chromosome in a manner that mirrors the locations of exons and CNEs in randomly selected 1.1-Mb regions in the human genome. Each panel shows windowed statistics calculated as described in the Materials and Methods and averaged across 1000 simulated replicates, and the mean value of each statistic across the neutral forward simulations is also shown as a dashed line. BGS, background selection; CNE, conserved noncoding element.

