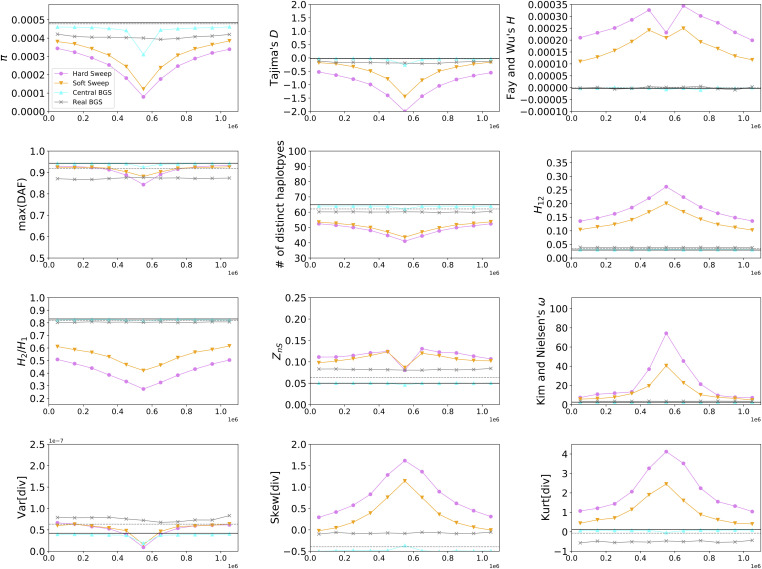
Figure 3.
Values of 15 statistics calculated in each of the simulation conditions shown in Figure 2. Here, the mean value of each statistic (calculated from 1000 simulation replicates) is shown in the 11 adjacent 100-kb windows within the 1.1-Mb chromosomal region. In each panel the neutral expectation of the statistic obtained from forward simulations are shown as a horizontal black line, while the neutral expectation from coalescent simulations is shown as a dashed gray line, although for most statistics these two expectations were essentially identical, for some there was a slight difference perhaps reflecting the subtle differences in the models used by the two simulators, and/or incomplete burn-in. DAF, derived allele frequency; div, divided.

