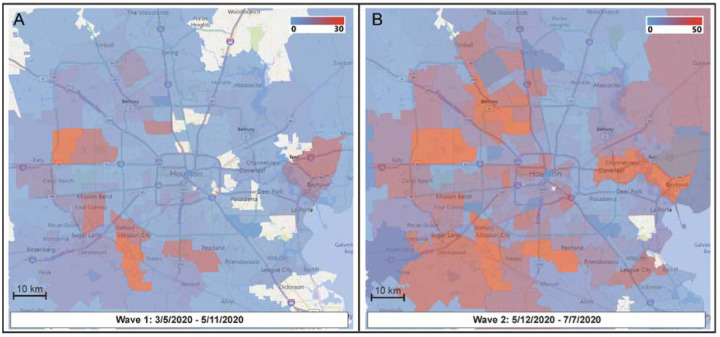
FIG 2.
Sequential time-series heatmaps for all COVID-19 Houston Methodist patients during the study period. Geospatial distribution of COVID-19 patients is based on zip code. Panel A (left) shows geospatial distribution of sequenced SARS-CoV-2 strains in wave 1 and panel B (right) shows wave 2 distribution. The collection dates are shown at the bottom of each panel. The insets refer to numbers of strains in the color spectrum used. Note difference in numbers of strains used in panel A and panel B insets.

