
Fig. 1.
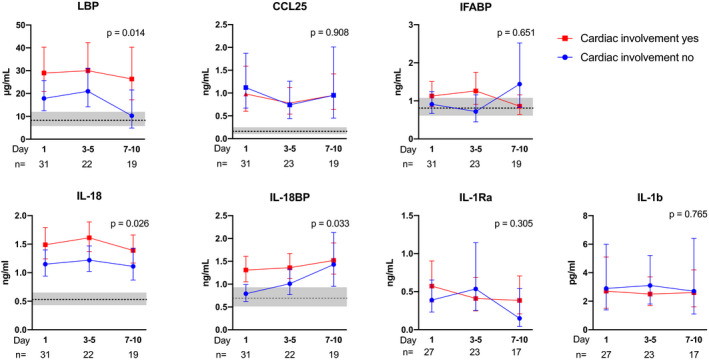
Circulating levels of gut and inflammasome markers in relation to cardiac involvement. Temporal course of gut‐related (upper panel) and inflammasome related (lower panel) markers during COVID‐19 infection according to cardiac involvement. Data are presented as back‐transformed estimated marginal means with 95% confidence intervals from the general linear model procedure (see Statistical methods) and the P‐value for the group effect according to cardiac involvement is given on the graphs. The grey area represents the estimated marginal mean (line) and 95% confidence interval (grey area) of healthy controls (n = 16).