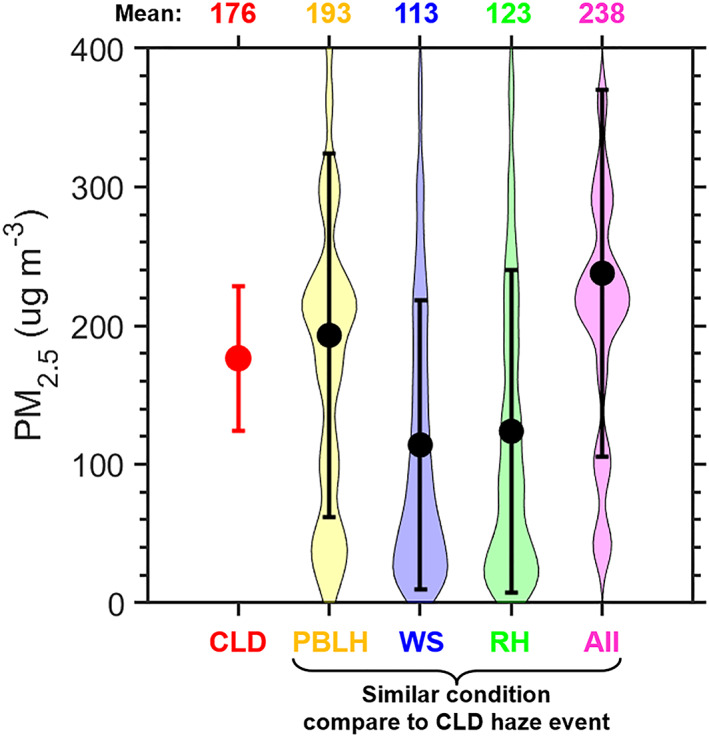
Figure 5.

The red dot and whisker represent the average value and standard deviation of daytime PM2.5 during the COVID lockdown (CLD) haze event in Beijing. Based on wintertime data from 2013 to 2019, days with a similar planetary boundary layer height (PBLH), wind speed (WS), relative humidity (RH), and all three are selected (less than 20% difference). The distribution of daytime PM2.5 is presented under these similar conditions. The black dot and whisker represent the average value and standard deviation, while the width of the color‐shaded areas represents the smoothed distribution of daytime PM2.5. The mean PM2.5 values for these categories are given at the top of the figure (unit: μg m−3).
