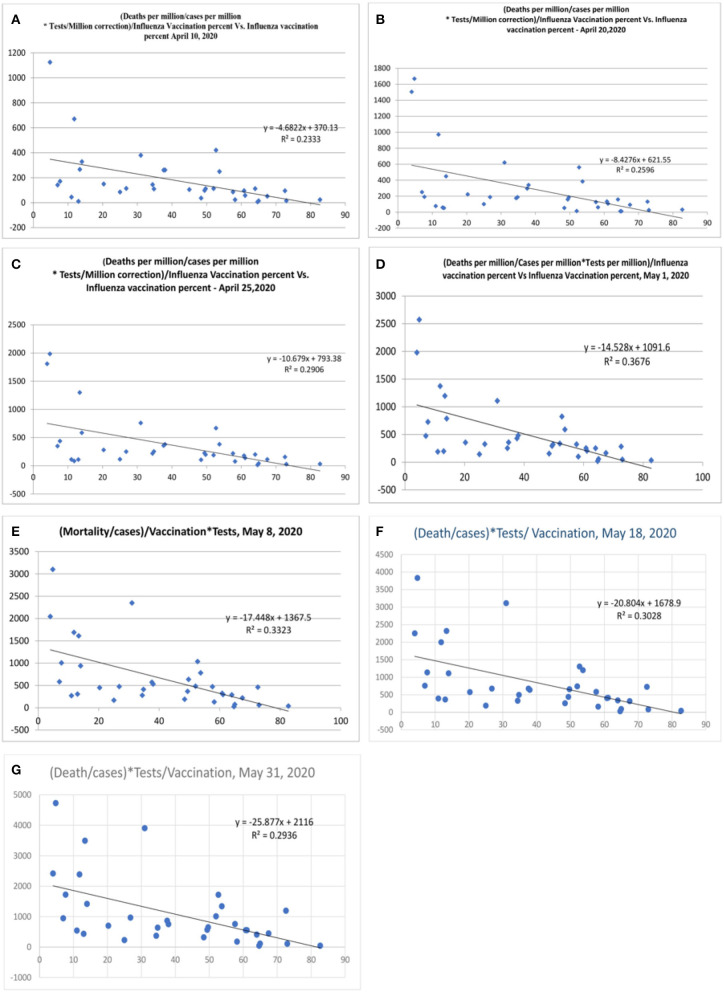
Figure 5.
Correlation between influenza vaccination percentage (age ≥ 65 years), vs. [(Deaths/million)/Cases per million]/Vaccination after correction for tests performed per million [(A), April 10, 2020, (B) April 20, 2020, (C) April 25, 2020, (D) May 1, 2020, (E) May 8, 2020, (F) May 18, 2020, and (G) May 31, 2020].

