

Abstract
The COVID‐19 pandemic has triggered numerous scientific activities aimed at understanding the SARS‐CoV‐2 virus and ultimately developing treatments. Structural biologists have already determined hundreds of experimental X‐ray, cryo‐EM, and NMR structures of proteins and nucleic acids related to this coronavirus, and this number is still growing. To help biomedical researchers, who may not necessarily be experts in structural biology, navigate through the flood of structural models, we have created an online resource, covid19.bioreproducibility.org, that aggregates expert‐verified information about SARS‐CoV‐2‐related macromolecular models. In this article, we describe this web resource along with the suite of tools and methodologies used for assessing the structures presented therein.
Keywords: coronavirus, COVID‐19, ligand assessment, PDB, reproducibility, SARS‐CoV‐2, structure validation, structure‐guided drug discovery
1. INTRODUCTION
The spread of the novel coronavirus around the world has triggered an unprecedented response from the scientific community. Six months into the pandemic, PubMed already listed over 23,000 scientific papers with the terms COVID‐19 or SARS‐CoV‐2 in the title, and tens of analyses are reported daily in mass media around the globe. Understandably, first‐line research findings, including molecular structure determinations, depositions in the Protein Data Bank (PDB), 1 and related results, are often made public on BioRxiv 2 or MedRxiv 3 before formal peer review. This approach delivers the latest results to scientists that develop treatments and vaccines without any delay but at the cost of elevated risk of mistakes and errors, which can mislead scientists performing follow‐up research and misinform the general public. The World Health Organization has even coined the portmanteau “infodemic” to describe the phenomenon of potentially misleading information overload. 4
As of July 27, 2020, the PDB has amassed 298 structural models of SARS‐CoV‐2‐related macromolecules, including proteins and RNA fragments. Structure‐based drug design depends on such molecular models, especially of complexes with candidate drugs slated for further development. However, the rapidly growing number of structures without corresponding publications and the potential mistakes associated with pandemic‐driven research can create confusion among biomedical researchers and could impede, rather than accelerate, drug development. Indeed, an analysis of the “entry history” of structures deposited to the PDB between January 24 and July 27, 2020 showed that as many as 56 out of the 182 (30.8%) SARS‐CoV‐2 structures (excluding PanDDA 5 fragment screening deposits) required a major revision of the initial model, whereas only 360 of the other 6,328 (5.9%) structures deposited during that time period had any major revisions. For 15 of the SARS‐CoV‐2 structures, the revisions were significant and involved replacement of the atomic coordinates. Some of these revisions were triggered by our resource. 6 Several structures have already been obsoleted and replaced with new deposits. In comparison, there were only seven coordinate replacements for all other structures deposited during that time (and among all the structures deposited in 2019, on average only less than 1 in 300 structures had a new version with coordinate replacement). The higher fraction of revised COVID‐related structures may in part be due to the celerity of the research, and in part to this and similar projects that requested original diffraction data, which prompted the authors of these structures to revisit their models. An additional factor, which may impede the use of molecular structures in biomedical research, is that they are sometimes presented in a way geared toward modeling and theoretical chemistry, but not for biomedical scientists that are not necessarily experts in protein crystallography.
In this article, we present covid‐19.bioreproduciblity.org, a web resource that organizes SARS‐CoV‐2 related structural information in a way that should be understandable and useful for a wider scientific community, and not only for structural biologists. The website also serves as a repository for examined and, if found to be suboptimal, corrected versions of PDB structures of SARS‐CoV‐2 proteins and RNA fragments, with a focus on assessing the small‐molecule ligands modeled in those structures. Moreover, we strive to re‐deposit the optimized structure models in the PDB, always in collaboration with the original authors. The validation tools and re‐refinement protocols used in this project can serve as a template for future molecular structure assessment efforts.
2. THE RESOURCE
Due to the rapid response in time of the pandemic, the covid‐19.bioreproducibility.org web resource was created in an agile, fast‐prototyping manner, focusing on speedy delivery and flexibility to accommodate changes. As a result, several new features are still being implemented. New data are evaluated and published on the website on a weekly basis, synchronized with the weekly releases of the PDB.
The website's main section (Figure 1) presents a table of assessed structures, preceded by a set of filters and export options. The filters (Figure 1A) allow users to select the experimental method, virus type, protein type, and ligand category. Our resource includes proteins and RNA fragments not only from SARS‐CoV‐2, but also a selection of structures of proteins from other closely related coronaviruses: HCoV, MERS, and SARS. To allow users to find specific fragments of the virus easily, the structures are categorized according to the function of the protein and the location of the corresponding genomic fragment. Ligands are categorized according to their involvement in the function of the protein to which they are bound. Ligands that may affect the protein function are called “functional ligands” (as opposed, for example, to the ligands that are artifacts of protein purification or crystallization, and there is no indication that their binding may affect the protein function). Users can also quickly filter for structures with or without functional ligands, protein–protein complexes, pathogen‐host interactions, and fragment screening results. The website also allows text searches (Figure 1B), and the data can be exported (Figure 1C). The selected structures are presented in a responsive table (Figure 1D) that adjusts the visibility of columns to the user's browser window. To preserve screen space, several pieces of information, such as the protein cartoon representation, full title, or the ligand diagram (Figure 1E), can be dynamically previewed upon mouse hover. Detailed information that cannot be presented directly in the table (such as re‐refinement details, full list of quality metrics, or associated files) can be viewed by expanding table rows (Figure 1F). For completeness, the 115 PanDDA models are listed, but we did not attempt to assess the quality of these models. PanDDA structures contain weakly bound potential ligands and thus may be of limited usefulness for translational research. With a few exceptions, we did not attempt to assess the quality of the cryo‐EM structures.
FIGURE 1.
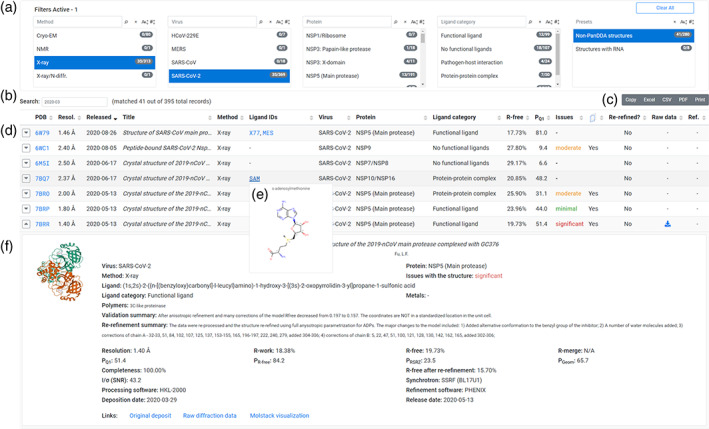
Structure section of the covid‐19.bioreproducibility.org web resource. A, Filter area, where the user can choose the experimental method, virus type, protein type, and ligand category. Multiple filters can be used simultaneously, and multiple options within each filter can be selected. B, Data can also be filtered using text search. C, Selected data can be exported to xlsx, csv, and pdf file formats. D, List of structures fulfilling user‐specified criteria. The table is responsive and adjusts the columns shown depending on the user's browser window width. E, Hover preview of ligands. A similar preview mechanism was implemented for the PDB column. F, Details of structures can be displayed by expanding table rows
Figure 2 presents some of the current statistics of covid‐19.bioreproducibility.org, excluding PanDDA fragment screening deposits. The resource hosts 160 X‐ray, 1 NMR, and 48 cryo‐EM structural models, only 13 of which had raw diffraction data available. As expected, X‐ray structures generally have a better resolution than the cryo‐EM structures (Figure 2A). According to the PQ1 metric, 7 the overall quality of SARS‐CoV‐2 structures is somewhat better than that of other, usually older, coronavirus structures in the resource (Figure 2B), but similar to other structures generated during the same time frame. Structures of SARS‐CoV‐2 macromolecules were determined at 13 different synchrotrons, and four were determined at a home source (Figure 2C). Most structures were determined at the beamlines 19‐ID, 21‐ID‐F (APS), BL17U1, BL19U1 (SSRF), and I03 (Diamond). The proteins with the highest numbers of structures are the main protease (also known as NSP5, 3CLPro, or Mpro) and the spike protein (S). The spike protein is the only protein whose structure was determined for a pathogen‐host interaction complex, and the main protease has most structures with functional ligands or inhibitors (Figure 2D). Exactly 58 of the SARS‐CoV‐2 structures in the resource have ligands that are recognized as pharmacological agents, 8 representing 22 different approved drugs.
FIGURE 2.
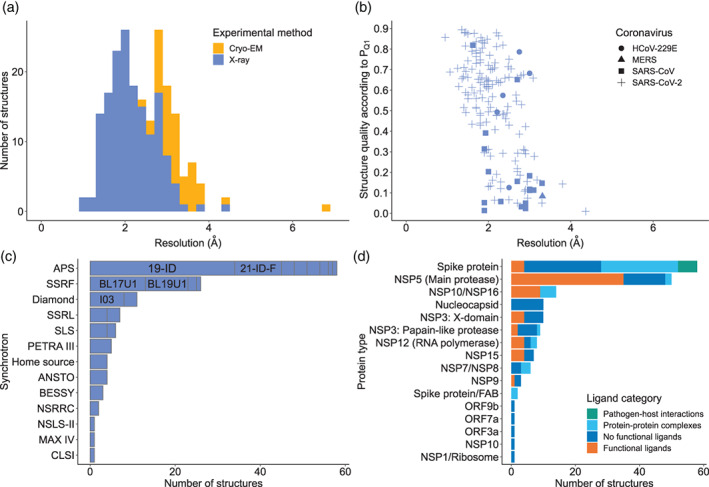
Structure statistics of the covid‐19.bioreproducibility.org web resource. A, Histogram of structure resolutions for X‐ray (blue) and cryo‐EM (orange) structures. B, The PQ1 quality percentile (expressed as fraction, the higher the better) of X‐ray structures, with the different types of coronaviruses in the resource depicted by different symbols. C, Number of SARS‐CoV‐2 structures determined at different synchrotrons; names of five top beamlines are shown. Full names of synchrotrons abbreviated on the plot are given in Table S1. D, Number of structures of different proteins of SARS‐CoV‐2, colored by ligand category
The resource is implemented in Python and uses the Flask web framework (https://flask.palletsprojects.com/) to serve the website. The frontend makes use of the Bootstrap (https://getbootstrap.com/) and DataTables (https://datatables.net/) libraries to provide searching, preview, sorting, and detail‐view capabilities. All the required data processing is done with the Pandas library 9 on the backend. Currently, all the information about structures presented on the website is organized in spreadsheets and stored in‐memory on the server. However, ultimately the data will be ported to a PostgreSQL database (http://www.postgresql.org) for better self‐consistency enforcement.
The website is updated weekly in a semi‐automatic fashion. Every week, we consult the update of the PDB's COVID‐19/SARS‐CoV‐2 Resources to obtain a list of the most recently released COVID‐19 related structures. We extract information about the structures from a copy of the PDBj Mine database 10 installed as a schema within an in‐house annotated database of structures. Moreover, we track changes to existing deposits, including primary citations related to structures released prior to publication as well as updated versions of atomic coordinates. For structures determined by X‐ray crystallography, we also search for raw diffraction images in the Integrated Resource for Reproducibility in Macromolecular Crystallography 11 or, if significant improvement might be expected, contact the authors with the request to submit the diffraction images. Moreover, we extract quality metrics related to structures by querying a locally installed copy of the PDBj's VRPT database schema. After the data have been automatically gathered from the above‐mentioned sources, they are processed by geometry checking, statistical, and validation tools, most of which were developed in‐house by the laboratories collaborating on this project. Finally, the structures are evaluated by a team of expert structural biologists who use a combination of the mined data, validation reports, and manual inspection of the protein models and associated electron density to examine potential problems. Careful attention is paid to all functional ligands and inhibitors contained in the structures. If potential problems are spotted, the diffraction data are re‐processed (whenever the raw data are available) and the models are re‐refined. The corrected models are made publicly available on our webserver. In addition, we always attempt to contact the original authors and encourage them to jointly re‐deposit the optimized models to the PDB. The details of the application of our structure evaluation tools and our structure correction protocol are discussed in the following sections.
3. EVALUATION OF THE STRUCTURE QUALITY
To make an informed decision whether a structure should be re‐refined or not, we use several criteria and tools to assess its quality. We check the overall geometry (Ramachandran outliers and rotamer outliers), the correlation between model and electron density map (especially for ligands), the presence of large peaks in difference electron density map, the placement of the macromolecular model in the unit cell, and whether R and Rfree are reasonable for the reported resolution.
Additionally, to provide a simple quantitative overview of the quality of X‐ray structures, we calculate and show on our website the PQ1 metric. 7 PQ1 is the structure's quality percentile (from 0 to 100, the higher the better) based on Rfree, RSRZ score, Clashscore, Ramachandran outliers, and Rotamer outliers. Being a hybrid reciprocal‐ and real‐space global metric, PQ1 can be easily used to sort structures and compare their overall quality. The PQ1 metric is recalculated weekly for each structure.
Equipped with the above‐mentioned validation tools, expert structural biologists may decide to manually inspect each structure in Coot. 12 If diffraction data are available, the potential gains of their manual re‐processing are analyzed. Using the calculated electron density maps, the main chain and side chains can be easily reviewed with Coot or Molstack. 13 Special emphasis is put on unmodeled electron density blobs. Based on such a review, a decision whether to re‐refine the structure is made. Full re‐refinement is a laborious process and sometimes requires contact with the deposition authors. In cases of deposits that do not have primary citations, the identification of the principal investigator (PI) is not always an easy task. For that reason, the Commission on Biological Macromolecules of the International Union of Crystallography (IUCr), together with the IUCr Committee on Data, has asked the PDB to publicly disclose the e‐mail address of the PI (or depositing author) of each deposit.
4. STRUCTURE CORRECTION PROTOCOL
Once the decision to re‐refine has been made, we use the following protocol to improve the model. Some aspects of this protocol are general in nature, and the exact values may be changed for a particular structure. The protocol and decisions made for each structure are based on our extensive experience in protein structure determination, 14 , 15 , 16 crystallographic software development, 17 , 18 published guidelines on structure refinement and structure quality, 7 , 19 , 20 and previous campaigns of PDB structure re‐refinement 21 , 22 :
4.1. Diffraction data
If raw diffraction data are available, the results of automatic processing of images by HKL‐3000auto are examined to verify that the structure was determined in the correct space group and at optimal resolution. In cases of inconsistent results, we use the HKL‐3000 program suite with the implementation of corrections for X‐ray absorption, radiation decay, and anisotropic diffraction. 18 , 23 , 24 Resolution cut‐offs are chosen based on the values of CC1/2, average signal‐to‐noise ratio 〈I/σ(I)〉, and Rmeas in the outermost resolution shell, as well as on the quality of the resulting electron density maps. 25 , 26 , 27
4.2. ACHESYM
Each structure under inspection is placed in a standardized way in the reference unit cell using ACHESYM. 28 Even though crystal structures can be presented with the molecular models located in various crystallographically equivalent locations, we seek to facilitate the process of comparisons of analogous structures for non‐crystallographers by placing the models as close to the origin of the unit cell as possible. 29 The ACHESYM server 28 takes into account the equivalence of the space group symmetry positions and adjusts the location of the model in the unit cell. As a result, the atomic coordinates and electron density maps of the re‐refined versions of isomorphous structures, that is, structures in the same space group and with differences for cell parameters a/b/c within 1.5% and cell angles within 5%, are standardized to the same location. This means that the macromolecules occupy similar positions in their corresponding unit cells and both the coordinates and electron density maps of isomorphous structures can be easily viewed as already superposed using any current computer graphics program.
4.3. Refinement in reciprocal space
The models subjected to restrained maximum posterior refinement in REFMAC 30 with hydrogen atoms added in riding positions. For all standard protein residues, the REFMAC dictionary is used as a source of ideal stereochemical targets, 31 whereas for nucleic acids the conformationally dependent restraints generated by the RestraintLib server 17 , 32 , 33 are used. Automatic local non‐crystallographic symmetry restraints are utilized if more than one protein molecule is present in the asymmetric unit. The TLS Motion Determination server 34 is used to define TLS groups and their initial parameters. Solvent molecules are not included in the TLS groups. The TLS parameterization is kept if confirmed by a significantly improved Rfree. Full anisotropic parametrization is utilized if the ratio of unique reflections to non‐hydrogen atoms is higher than 18 (corresponding to data‐to‐parameters ratio higher than two) and if it resulted in significant (over 2%) drop of Rfree. The Hamilton R‐factor‐ratio test 35 is used to decide whether the choice of anisotropic parametrization is justified. For most structures, we manually adjusted stereochemical weights aiming at bond length and bond angle rmsd values in the range of 0.010–0.015 Å and 1.6–2.0°, respectively. Multiple tools integrated into Coot, 12 , 36 a standalone version of MolProbity, 37 as well as the PDB validation tools are used for structure quality assessment.
4.4. Manual model correction
After each round of REFMAC refinement, the atomic model is manually inspected and corrected according to the following checklist:
Review unmodeled electron density blobs, which might represent ligands or residues missing from the polymer model.
Inspect all difference electron density peaks above 4.0 rmsd (5.0 rmsd if there are too many peaks). Inspect the strongest negative density peaks.
Inspect rotamer outliers, which may indicate incorrect placement of side chains, as well as residues with missing atoms.
Review density fit graphs and inspect poorly fitting residues; verify terminal residue placement; and inspect any gaps in the sequence.
Inspect Ramachandran outliers.
Once large electron density blobs have been modeled and major issues with the protein backbone have been addressed, look for potential water molecules to add, with peaks above 1.1 rmsd in the 2mFo‐DFc map and distances to protein H‐bonded atoms ranging from 2.4 to 4.0 Å.
4.5. Ligand modeling and metal identification
If unmodeled electron density blobs are found during manual corrections, they are considered as potential ligands. In such cases, we try to identify the ligand with the help of CheckMyBlob, 38 fit the ligand in the density, and run no fewer than 10 REFMAC cycles. If the ligand does not have a proper stereochemical description in the standard REFMAC dictionary, new geometrical restraints are generated using the Grade Web Server 39 and carefully checked before use. Since ligands originally modeled in the deposition may be incorrect, 22 they are inspected visually and, if questionable, validated using CheckMyBlob. 38 Similarly, it has been shown that a significant fraction of metal‐containing structures in the PDB have incorrect metal assignment or modeling. 40 Therefore, special attention is given to metal identification by the CheckMyMetal validation server 41 and, when possible, using anomalous maps calculated with data collected above and below the X‐ray absorption edge. 42
Challenging cases are discussed by at least two team members. Many structures are inspected by at least one other expert after the refinement has been completed. The revised structures are stored in the web resource described here, along with a description of the identified issues and changes made. However, if the changes are significant, the goal is to re‐deposit the re‐refined structure in the PDB, preferably together with the original authors, using the mechanism of re‐versioning. An example report for a structure re‐processed from original data and re‐refined according to the above protocol is presented in Figure 3 and Figure S1. A report showing a case when the original diffraction data were not available is presented in Figures S2 and S3.
FIGURE 3.
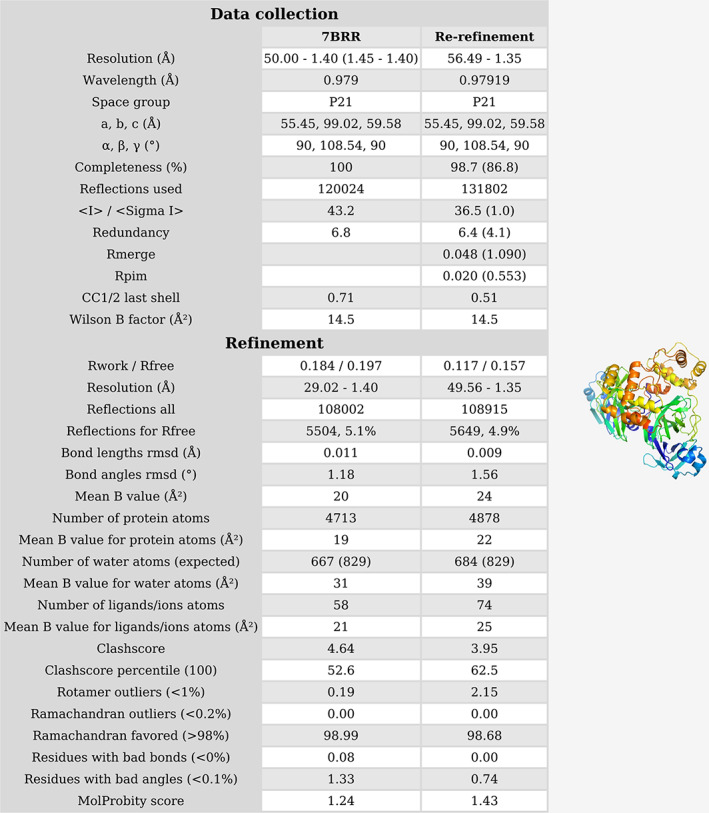
Report showing the re‐processing and re‐refinement of PDB structure 7BRR. This structure will be re‐deposited to the PDB under a new PDB ID, due to significant changes in comparison with the original deposit. The second part of the report is presented in Figure S1
5. DISCUSSION
The goal of the covid‐19.bioreproducibility.org web resource is to gather macromolecular structures related to the SARS‐CoV‐2 virus and assess them using state‐of‐the‐art tools. Additionally, we aim to provide information that can be easily used by non‐structural biologists. That is why the structures are categorized according to the experimental method, virus type, protein type, and ligand category. We also attempt to facilitate quick overall structure assessment for general users by calculating aggregated quality metrics, such as the PQ1 percentile. Finally, we make sure that isomorphous structures solved in the same space group can be easily compared, by moving them into standardized location of the reference unit cell. Although non‐uniform model placement in the unit cell may not seem to be a serious issue for trained crystallographers, for many biomedical researchers it makes comparison harder as isomorphousstructures may appear to be completely different, leading to confusion and misinterpretations.
During the work on the server, we made several disturbing observations. First, in several cases, the deposited images were clearly not compatible with the diffraction data used for structure refinement. Second, some of the contacted scientists claimed that the diffraction data were deleted immediately after processing in order to save disk space. Third, several scientists did not respond to our request to provide their data, despite the IUCr recommendation 43 and an appeal from the community to make diffraction data related to SARS‐CoV‐2 public (http://phenix‐online.org/pipermail/phenixbb/2020‐March/024556). However, in one case 6 our request resulted in the original authors re‐depositing an optimized structure instead of depositing the diffraction data. All of the above facts show that the struggle for reproducibility of scientific results is an uphill battle, and suggest that leading scientific journals should do more 44 , 45 than run editorials about the need to improve the reproducibility of scientific results.
It is worth noting that the described web resource is not the only project established with the aim of validating, correcting, or providing additional information on COVID‐19 related structures. The most notable other examples have been set by Gerard Bricogne's group at Global Phasing (https://www.globalphasing.com/buster/wiki/index.cgi?Covid19), Jane and David Richardson's group at Duke University (http://kinemage.biochem.duke.edu/), and Andrea Thorn's group at the University of Würzburg (https://github.com/thorn-lab/coronavirus_structural_task_force).
With vaccines in late‐stage development 46 , 47 and the first reports of drugs increasing survival chances, 48 the COVID‐19 pandemic will hopefully end soon. However, this may not necessarily be the end of the SARS‐CoV‐2 coronavirus, as it may evolve in yet unforeseen ways to evade vaccines and treatments. Therefore, we will keep improving the web resource presented herein, with the hope that it will remain useful to biologists during the present pandemic and that it will set standards for any future health crises.
AUTHOR CONTRIBUTIONS
Dariusz Brzezinski: Data curation; methodology; software; validation; visualization; writing‐original draft; writing‐review and editing. Marcin Kowiel: Data curation; investigation; software; validation; writing‐original draft; writing‐review and editing. David Cooper: Data curation; investigation; validation; writing‐review and editing. Marcin Cymborowski: Data curation; software; validation. Marek Grabowski: Formal analysis; software; writing‐review and editing. Alexander Wlodawer: Conceptualization; data curation; formal analysis; investigation; supervision; writing‐review and editing. Zbigniew Dauter: Formal analysis; investigation; validation; writing‐review and editing. Ivan Shabalin: Data curation; formal analysis; investigation; methodology; validation; writing‐original draft; writing‐review and editing. Miroslaw Gilski: Formal analysis; validation; writing‐review and editing. Bernhard Rupp: Data curation; formal analysis; investigation; methodology; validation; writing‐review and editing. Mariusz Jaskolski: Conceptualization; formal analysis; funding acquisition; methodology; supervision; validation; writing‐original draft; writing‐review and editing. Wladek Minor: Conceptualization; data curation; formal analysis; funding acquisition; project administration; resources; supervision; validation; writing‐original draft; writing‐review and editing.
CONFLICT OF INTEREST
One of the authors (WM) notes that he has also been involved in the development of software and data management and mining tools; some of them were commercialized by HKL Research and are mentioned in the paper. WM is the co‐founder of HKL Research and a member of the board. The authors have no other relevant affiliations or financial involvement with any organization or entity with a financial interest in or financial conflict with the subject matter or materials discussed in the manuscript apart from those disclosed.
Supporting information
Supplementary Table S1 Synchrotron names and abbreviations.
Supplementary Figure S1. Report of an optimization when diffraction data were available (deposit 7BRR); part II.
Supplementary Figure S2. Report of minor structure optimization when diffraction data were not available (deposit 6VW1); part I.
Supplementary Figure S3. Report of minor structure optimization when diffraction data were not available (deposit 6VW1); part II.
ACKNOWLEDGEMENTS
This work was supported in part by the Intramural Research Program of the NIH, National Cancer Institute, Center for Cancer Research, and by NIGMS grant R01‐GM132595. DB acknowledges the support of the Polish National Agency for Academic Exchange under Grant No. PPN/BEK/2018/1/00058/U/00001. BR acknowledges partial funding through FWF (Austrian Science Foundation) grant P 32821. We also acknowledge support of the National Science Center (NCN, Poland), grant No. 2020/01/0/NZ1/00134 to MJ.
Brzezinski D, Kowiel M, Cooper DR, et al. Covid‐19.bioreproducibility.org: A web resource for SARS‐CoV‐2‐related structural models. Protein Science. 2021;30:115–124. 10.1002/pro.3959
Funding information Austrian Science Fund, Grant/Award Number: P32821; Intramural Research Program of the NIH, National Cancer Institute, Center for Cancer Research; Narodowe Centrum Nauki, Grant/Award Number: 2020/01/0/NZ1/00134; National Institute of General Medical Sciences, Grant/Award Number: R01‐GM132595; Polish National Agency for Academic Exchange, Grant/Award Number: PPN/BEK/2018/00058/U/00001
REFERENCES
- 1. Burley SK, Berman HM, Christie C, et al. RCSB Protein Data Bank: Sustaining a living digital data resource that enables breakthroughs in scientific research and biomedical education. Protein Sci. 2018;27:316–330. [DOI] [PMC free article] [PubMed] [Google Scholar]
- 2. Sever R, Roeder T, Hindle S, et al. bioRxiv: The preprint server for biology. bioRxiv. 2019;1–19. 10.1101/833400. [DOI] [Google Scholar]
- 3. Rawlinson C, Bloom T. New preprint server for medical research. BMJ. 2019;365:l2301. [DOI] [PubMed] [Google Scholar]
- 4. Ruffell D. Coronavirus SARS‐CoV‐2: Filtering fact from fiction in the infodemic. FEBS Lett. 2020;594:1127–1131. [DOI] [PMC free article] [PubMed] [Google Scholar]
- 5. Pearce NM, Krojer T, Bradley AR, et al. A multi‐crystal method for extracting obscured crystallographic states from conventionally uninterpretable electron density. Nat Commun. 2017;8:15123. [DOI] [PMC free article] [PubMed] [Google Scholar]
- 6. Wlodawer A, Dauter Z, Shabalin IG, et al. Ligand‐centered assessment of SARS‐CoV‐2 drug target models in the Protein Data Bank. FEBS J. 2020;287:3703–3718. [DOI] [PMC free article] [PubMed] [Google Scholar]
- 7. Brzezinski D, Dauter Z, Minor W, Jaskolski M. On the evolution of the quality of macromolecular models in the PDB. FEBS J. 2020;287:2685–2698. [DOI] [PMC free article] [PubMed] [Google Scholar]
- 8. Wishart DS, Feunang YD, Guo AC, et al. DrugBank 5.0: A major update to the DrugBank database for 2018. Nucleic Acids Res. 2018;46:D1074–D1082. [DOI] [PMC free article] [PubMed] [Google Scholar]
- 9. McKinney W. Data structures for statistical computing in Python. In: Proc. of the 9th Python in Science Conf. (SCIPY 2010). 2010; pp. 56–61.
- 10. Kinjo AR, Yamashita R, Nakamura H. PDBj Mine: Design and implementation of relational database interface for Protein Data Bank Japan. Database 2010:baq021–baq021. [DOI] [PMC free article] [PubMed]
- 11. Grabowski M, Langner KM, Cymborowski M, et al. A public database of macromolecular diffraction experiments. Acta Cryst. 2016;D72:1181–1193. [DOI] [PMC free article] [PubMed] [Google Scholar]
- 12. Casañal A, Lohkamp B, Emsley P. Current developments in Coot for macromolecular model building of electron cryo‐microscopy and crystallographic data. Protein Sci. 2020;29:1055–1064. [DOI] [PMC free article] [PubMed] [Google Scholar]
- 13. Porebski PJ, Bokota G, Venkataramany BS, Minor W. Molstack: A platform for interactive presentations of electron density and cryo‐EM maps and their interpretations. Protein Sci. 2020;29:120–127. [DOI] [PMC free article] [PubMed] [Google Scholar]
- 14. Kutner J, Shabalin IG, Matelska D, et al. Structural, biochemical, and evolutionary characterizations of glyoxylate/hydroxypyruvate reductases show their division into two distinct subfamilies. Biochemistry. 2018;57:963–977. [DOI] [PMC free article] [PubMed] [Google Scholar]
- 15. Czub MP, Handing KB, Venkataramany BS, Cooper DR, Shabalin IG, Minor W. Albumin‐based transport of nonsteroidal anti‐inflammatory drugs in mammalian blood plasma. J Med Chem. 2020;63:6847–6862. [DOI] [PMC free article] [PubMed] [Google Scholar]
- 16. Rupp B. Biomolecular crystallography: Principles, practice, and application to structural biology. New York, NY: Garland Science, 2009. [Google Scholar]
- 17. Kowiel M, Brzezinski D, Gilski M, Jaskolski M. Conformation‐dependent restraints for polynucleotides: The sugar moiety. Nucleic Acids Res. 2020;48:962–973. [DOI] [PMC free article] [PubMed] [Google Scholar]
- 18. Minor W, Cymborowski M, Otwinowski Z, Chruszcz M. HKL‐3000: The integration of data reduction and structure solution—from diffraction images to an initial model in minutes. Acta Cryst. 2006;D62:859–866. [DOI] [PubMed] [Google Scholar]
- 19. Shabalin IG, Porebski PJ, Minor W. Refining the macromolecular model – achieving the best agreement with the data from X‐ray diffraction experiment. Crystallogr Rev. 2018;24:236–262. [DOI] [PMC free article] [PubMed] [Google Scholar]
- 20. Majorek KA, Zimmerman MD, Grabowski M, Shabalin IG, Zheng H, Minor W. Assessment of crystallographic structure quality and protein–ligand complex structure validation Structural Biology in Drug Discovery. Hoboken, NJ, USA: Wiley, 2020; p. 253–275. [Google Scholar]
- 21. Raczynska JE, Shabalin IG, Minor W, Wlodawer A, Jaskolski M. A close look onto structural models and primary ligands of metallo‐β‐lactamases. Drug Resist Updat. 2018;40:1–12. [DOI] [PMC free article] [PubMed] [Google Scholar]
- 22. Wlodawer A, Dauter Z, Porebski PJ, et al. Detect, correct, retract: How to manage incorrect structural models. FEBS J. 2018;285:444–466. [DOI] [PMC free article] [PubMed] [Google Scholar]
- 23. Otwinowski Z, Minor W. Processing of X‐ray diffraction data collected in oscillation mode. Methods Enzymol. 1997;276:307–326. [DOI] [PubMed] [Google Scholar]
- 24. Borek D, Cymborowski M, Machius M, Minor W, Otwinowski Z. Diffraction data analysis in the presence of radiation damage. Acta Cryst. 2010;D66:426–436. [DOI] [PMC free article] [PubMed] [Google Scholar]
- 25. Luo Z, Rajashankar K, Dauter Z. Weak data do not make a free lunch, only a cheap meal. Acta Cryst. 2014;D70:253–260. [DOI] [PMC free article] [PubMed] [Google Scholar]
- 26. Evans PR, Murshudov GN. How good are my data and what is the resolution? Acta Cryst. 2013;D69:1204–1214. [DOI] [PMC free article] [PubMed] [Google Scholar]
- 27. Karplus PA, Diederichs K. Linking crystallographic model and data quality. Science. 2012;336:1030–1033. [DOI] [PMC free article] [PubMed] [Google Scholar]
- 28. Kowiel M, Jaskolski M, Dauter Z. ACHESYM: An algorithm and server for standardized placement of macromolecular models in the unit cell. Acta Cryst. 2014;D70:3290–3298. [DOI] [PMC free article] [PubMed] [Google Scholar]
- 29. Dauter Z. On optimal placement of molecules in the unit cell. Acta Cryst. 2013;D69:872–878. [DOI] [PMC free article] [PubMed] [Google Scholar]
- 30. Kovalevskiy O, Nicholls RA, Long F, Carlon A, Murshudov GN. Overview of refinement procedures within REFMAC5: Utilizing data from different sources. Acta Cryst. 2018;D74:215–227. [DOI] [PMC free article] [PubMed] [Google Scholar]
- 31. Engh RA, Huber R. Accurate bond and angle parameters for X‐ray protein structure refinement. Acta Cryst. 1991;A47:392–400. [Google Scholar]
- 32. Kowiel M, Brzezinski D, Jaskolski M. Conformation‐dependent restraints for polynucleotides: I. Clustering of the geometry of the phosphodiester group. Nucleic Acids Res. 2016;44:8479–8489. [DOI] [PMC free article] [PubMed] [Google Scholar]
- 33. Gilski M, Zhao J, Kowiel M, Brzezinski D, Turner DH, Jaskolski M. Accurate geometrical restraints for Watson–Crick base pairs. Acta Crystallogr. 2019;B75:235–245. [DOI] [PMC free article] [PubMed] [Google Scholar]
- 34. Painter J, Merritt EA. TLSMD web server for the generation of multi‐group TLS models. J Appl Cryst. 2006;39:109–111. [Google Scholar]
- 35. Hamilton WC. Significance tests on the crystallographic R factor. Acta Crystallogr. 1965;18:502–510. [Google Scholar]
- 36. Emsley P, Lohkamp B, Scott WG, Cowtan K. Features and development of Coot. Acta Cryst. 2010;D66:486–501. [DOI] [PMC free article] [PubMed] [Google Scholar]
- 37. Williams CJ, Headd JJ, Moriarty NW, et al. MolProbity: More and better reference data for improved all‐atom structure validation. Protein Sci. 2018;27:293–315. [DOI] [PMC free article] [PubMed] [Google Scholar]
- 38. Kowiel M, Brzezinski D, Porebski PJ, Shabalin IG, Jaskolski M, Minor W. Automatic recognition of ligands in electron density by machine learning. Bioinformatics. 2019;35:452–461. [DOI] [PMC free article] [PubMed] [Google Scholar]
- 39. Smart O, Womack T, Sharff A, Flensburg C, Keller P, Paciorek W, Vonrhein C, Bricogne G. Grade Web Server; 2011. http://www.globalphasing.com [DOI] [PMC free article] [PubMed]
- 40. Zheng H, Shabalin IG, Handing KB, Bujnicki JM, Minor W. Magnesium‐binding architectures in RNA crystal structures: Validation, binding preferences, classification and motif detection. Nucleic Acids Res. 2015;43:3789–3801. [DOI] [PMC free article] [PubMed] [Google Scholar]
- 41. Zheng H, Cooper DR, Porebski PJ, Shabalin IG, Handing KB, Minor W. CheckMyMetal: A macromolecular metal‐binding validation tool. Acta Cryst. 2017;D73:223–233. [DOI] [PMC free article] [PubMed] [Google Scholar]
- 42. Handing KB, Niedzialkowska E, Shabalin IG, Kuhn ML, Zheng H, Minor W. Characterizing metal‐binding sites in proteins with X‐ray crystallography. Nat Protoc. 2018;13:1062–1090. [DOI] [PMC free article] [PubMed] [Google Scholar]
- 43. Helliwell JR, Minor W, Weiss MS, et al. Findable accessible Interoperable Re‐usable (FAIR) diffraction data are coming to protein crystallography. Acta Crystallogr. 2019;D75:455–457. [DOI] [PMC free article] [PubMed] [Google Scholar]
- 44. Miyakawa T. No raw data, no science: Another possible source of the reproducibility crisis. Mol Brain. 2020;13:24. [DOI] [PMC free article] [PubMed] [Google Scholar]
- 45. Minor W, Cooper DR. Faculty opinions recommendation of [Miyakawa T, Mol Brain 2020 13(1):24]. Fac. Opin. DOI: 10.3410/f.737405003.793574963
- 46. Folegatti PM, Ewer KJ, Aley PK, et al. Safety and immunogenicity of the ChAdOx1 nCoV‐19 vaccine against SARS‐CoV‐2: A preliminary report of a phase 1/2, single‐blind, randomised controlled trial. Lancet. 2020;396:467–478. [DOI] [PMC free article] [PubMed] [Google Scholar]
- 47. Zhu F‐C, Guan X‐H, Li Y‐H, et al. Immunogenicity and safety of a recombinant adenovirus type‐5‐vectored COVID‐19 vaccine in healthy adults aged 18 years or older: A randomised, double‐blind, placebo‐controlled, phase 2 trial. Lancet. 2020;396:479–488. [DOI] [PMC free article] [PubMed] [Google Scholar]
- 48. The RECOVERY Collaborative Group . Dexamethasone in Hospitalized Patients with Covid‐19 — Preliminary Report. New England Journal of Medicine, 2020; NEJMoa2021436. [Google Scholar]
Associated Data
This section collects any data citations, data availability statements, or supplementary materials included in this article.
Supplementary Materials
Supplementary Table S1 Synchrotron names and abbreviations.
Supplementary Figure S1. Report of an optimization when diffraction data were available (deposit 7BRR); part II.
Supplementary Figure S2. Report of minor structure optimization when diffraction data were not available (deposit 6VW1); part I.
Supplementary Figure S3. Report of minor structure optimization when diffraction data were not available (deposit 6VW1); part II.