
FIGURE 2.
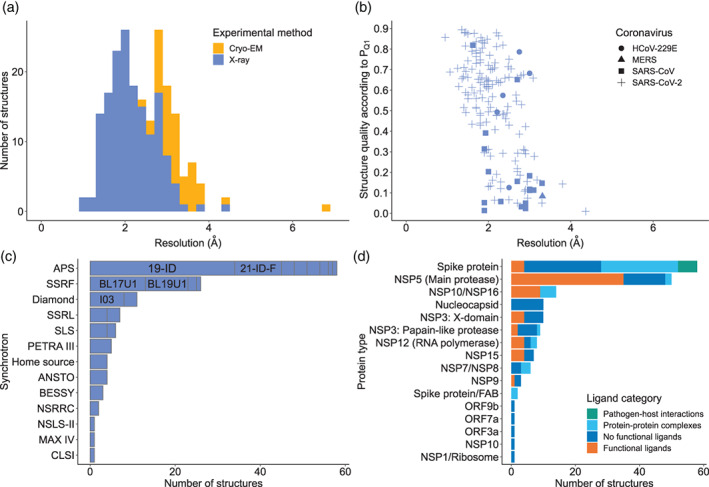
Structure statistics of the covid‐19.bioreproducibility.org web resource. A, Histogram of structure resolutions for X‐ray (blue) and cryo‐EM (orange) structures. B, The PQ1 quality percentile (expressed as fraction, the higher the better) of X‐ray structures, with the different types of coronaviruses in the resource depicted by different symbols. C, Number of SARS‐CoV‐2 structures determined at different synchrotrons; names of five top beamlines are shown. Full names of synchrotrons abbreviated on the plot are given in Table S1. D, Number of structures of different proteins of SARS‐CoV‐2, colored by ligand category