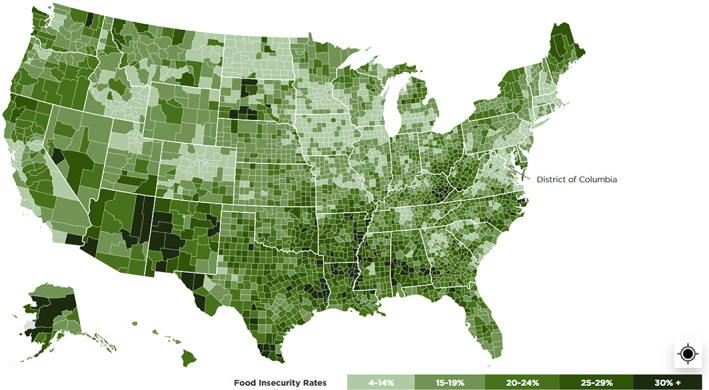
Figure 2.

Estimates of Food Insecurity Rates for Children by County, 2018Notes: These results are based on imputations derived from the 2009 to 2018 December Supplements of the Current Population Survey and the 2014 to 2018 American Community Survey. [Color figure can be viewed at wileyonlinelibrary.com]
