Figure 1.

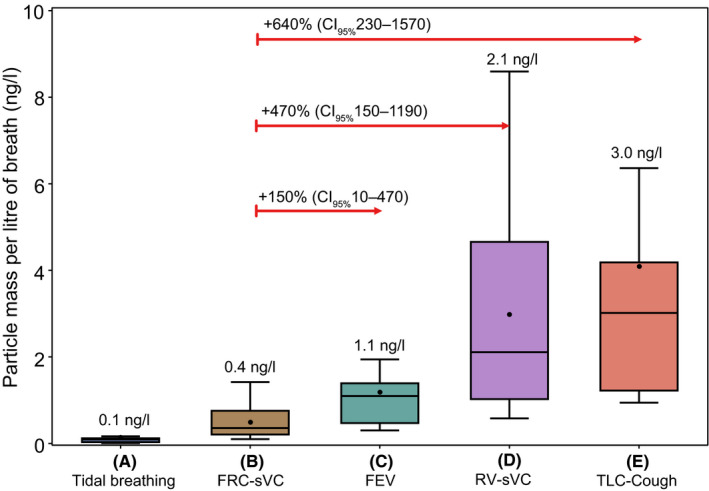
Mass of exhaled particles per breath using PExA following different breathing manoeuvres. Median values are shown above each plot. Box and whisker plots are median (line), mean (dot) with interquartile range (box) and range (whiskers)

Mass of exhaled particles per breath using PExA following different breathing manoeuvres. Median values are shown above each plot. Box and whisker plots are median (line), mean (dot) with interquartile range (box) and range (whiskers)