Figure 2.

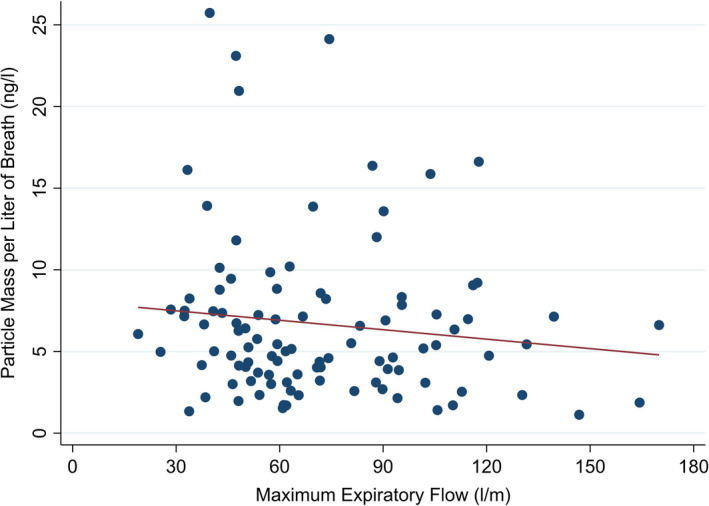
Scatterplot of mass of exhaled particles per breath using PExA in relation to maximum exhalation flow rate. No significant relationship with flow rate was seen (Linear regression line shown in red)

Scatterplot of mass of exhaled particles per breath using PExA in relation to maximum exhalation flow rate. No significant relationship with flow rate was seen (Linear regression line shown in red)