
Figure 1.
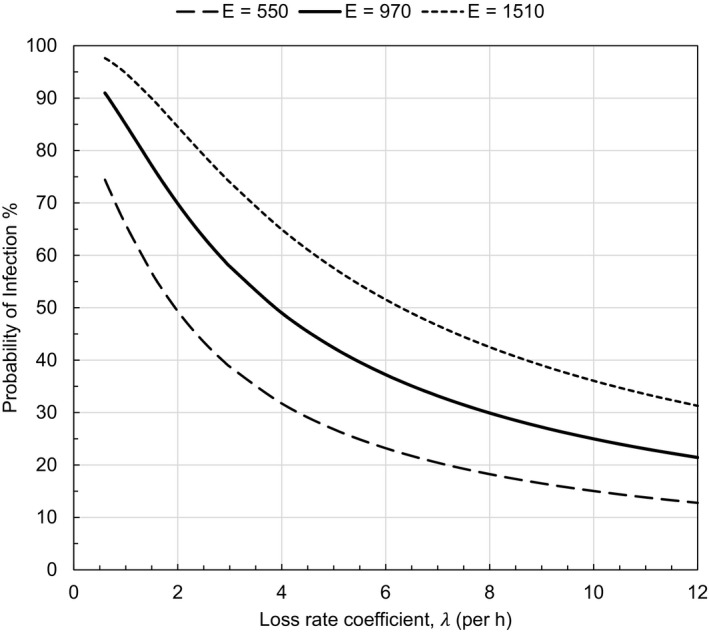
Probability of infection for each rehearsal participant as a function of loss rates for varying aerosol quanta emission rates (E, q/h). Infection probability is plotted for the predicted mean emission rate (970 q/h) and the 10th and 90th percentile emission rates (550 and 1510 q/h, respectively.) Constant values were assumed for rehearsal duration (2.5 h), indoor volume (810 m3) and volumetric breathing rate (1.0 m3/h)