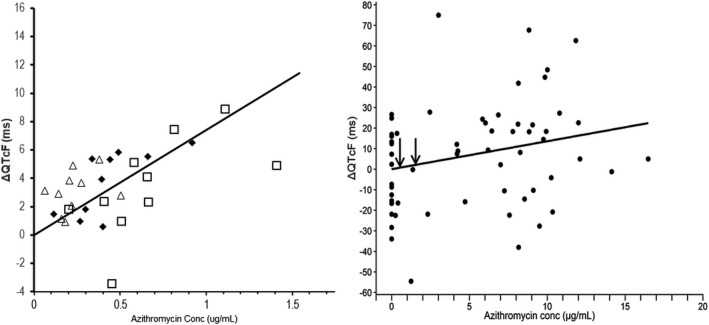
Figure 1.

Relationship between azithromycin (AZ) concentration and Fridericia’s rate‐corrected QT interval (∆QTcF) on day 3 following oral administration of AZ and chloroquine (CQ) for 3 days (left panel) or following a single i.v. infusion of AZ (right panel). In the left panel, the mean differences in time matched changes from baseline in ∆QTcF between CQ plus AZ groups and CQ were regressed against corresponding mean AZ concentrations. In the regression model, treatment group was included as a random effect, AZ was included as a fixed effect, and there was no intercept term. (Legend: triangles: CQ + 500 mg AZ; diamonds: CQ + 1,000 mg AZ; squares: CQ + 1,500 mg AZ; solid line: regression model predictions). Right panel legend: circles represent individual subject data; solid line: regression model prediction; arrows represent corresponding mean peak plasma concentration (Cmax) values from the oral study after 500 mg and 1,500 mg dose of AZ as noted in Table 1 .
