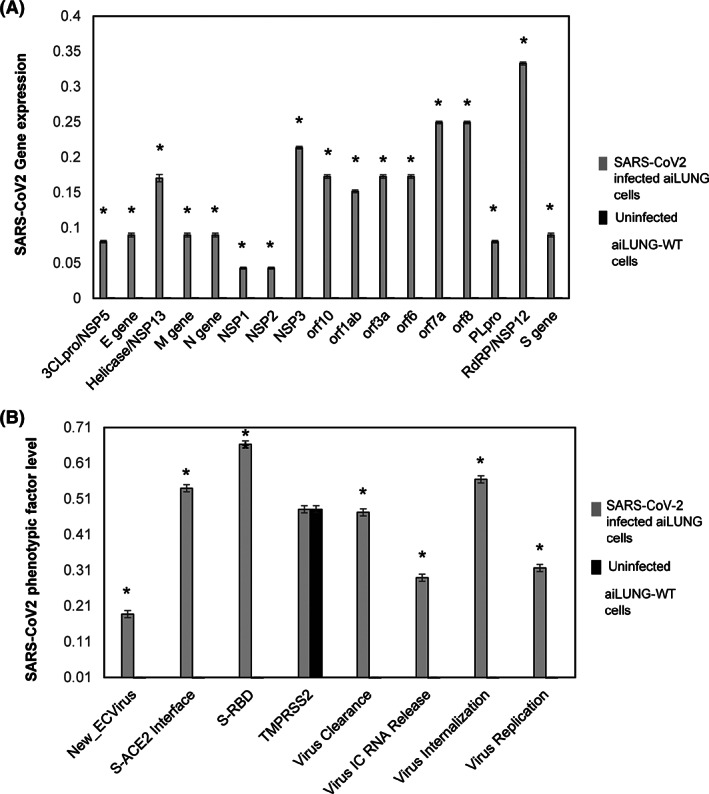
FIGURE 2.

DeepNEU successful simulation of SARS‐CoV‐2‐infected aiLUNG cells. A, Expression of (N = 17) SARS‐CoV‐2 genotypic features (genes/proteins) in aiLUNG cells. B, Expression of viral phenotypic features (N = 8) strength in SARS‐CoV‐2 infected aiLUNG cells. The vertical y‐axis represents the semiquantitative levels of genotypic and phenotypic factors that are estimated regarding an arbitrary base line where 0 = base line and 1 = maximum expression, The y‐axis represents the expression level of each factor relative to arbitrary baseline. Data represent mean of three independent experiments ± 99% confidence interval. *P < .05
