
FIGURE 1.
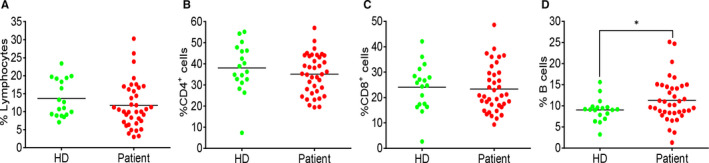
Percentage changes in T and B cells between HDs and COVID‐19 patients. (A) The percentage of lymphocytes in total blood cells. (B) The percentage of CD4+ T cells in lymphocyte population. (C) The percentage of CD8+ T cells in lymphocyte population. (D) The percentage of B cells in lymphocyte population. Each dot represents a single patient of COVID‐19 or healthy donor. *P<0.05 was considered statistically significant