
FIGURE 2.
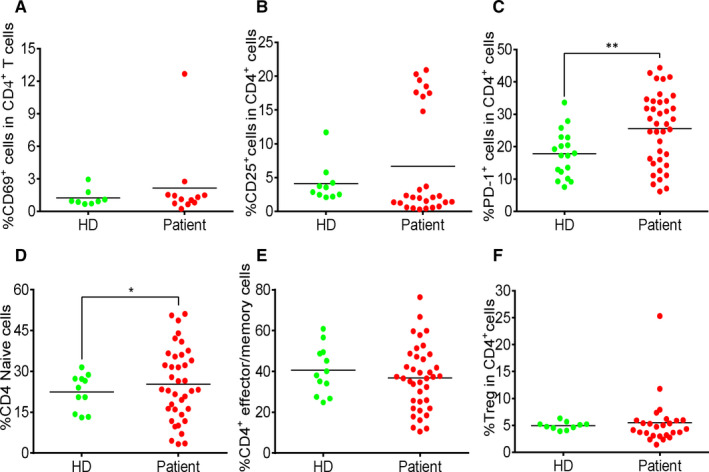
Moderate increase in activated CD4+ T cells in COVID‐19 patients. (A) The percentage of CD69+ cells in CD4+ T cells. (B) The percentage of CD25+ cells in CD4+ T cells. (C) The percentage of PD‐1+ cells in CD4+ T cells. (D) The percentage of CD45RA+CD45RO‐ cells in CD4+ T cells. (E) The percentage of CD45RA‐CD45RO+ cells in CD4+ T cells. (F) The percentage of regulatory T cells in CD4+ T cells. Each dot represents a single patient of COVID‐19 or healthy donor. *P<0.05 and **P<0.01 were considered statistically significant and extremely significant, respectively