
FIGURE 5.
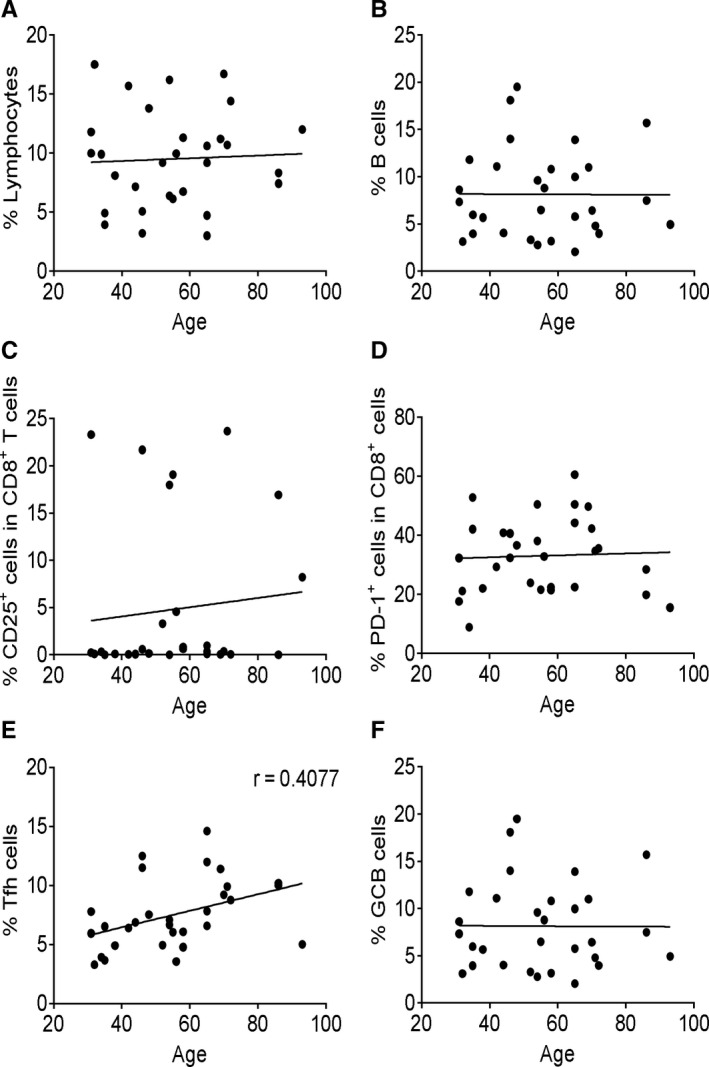
Correlation analysis between functional signature and patient age. The correlation analysis between patient age and immune parameters was performed using Pearson’s correlation coefficient. The percentage of total lymphocytes (A), B cells (B), CD8+CD25+ T cells (C), CD8+PD‐1+ T cells (D), Tfh‐like cells (E) and GCB‐like cells (F) was correlated with age in COVID‐19 patient group. Each dot represents a single patient of COVID‐19 or healthy donor. Patients under the age of 15 years were excluded