
Figure 3.
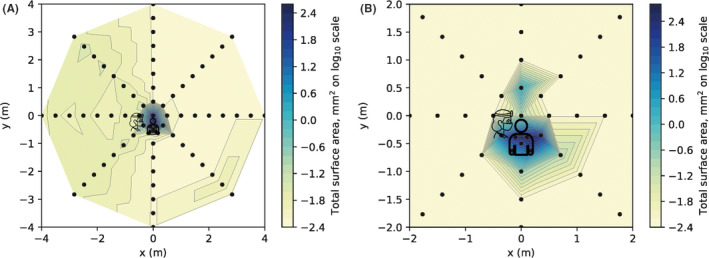
Heatmap showing surface area outcome measure for two clinical procedures. A, ultrasonic scaling. B, 3‐in‐1 spray. For each coordinate, the maximum value recorded from three repetitions of each clinical procedure was used as this was deemed most clinically relevant. Logarithmic transformation was performed on the data (Log10). Note the scale is reduced to remove areas showing zero readings in panel B only [Colour figure can be viewed at wileyonlinelibrary.com]