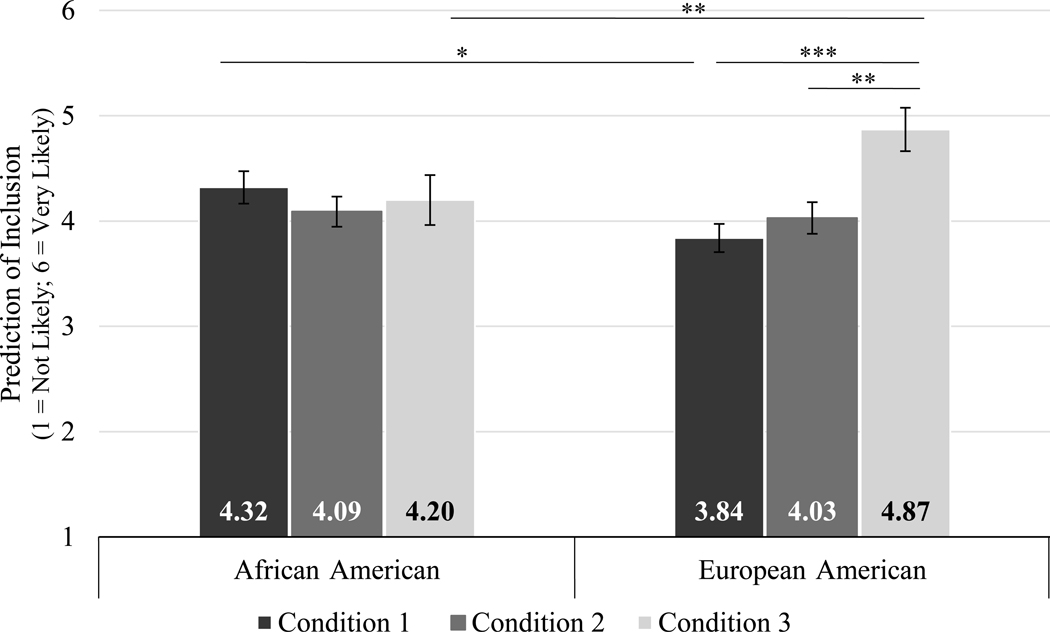
Figure 2.
Prediction of inclusion by racial composition and participant race. Higher scores indicate predicting greater likelihood of inclusion.
Note. Error bars represent standard errors of the mean and *p < .05, **p < .01, ***p < .001. Condition 1) Interracial: European-American peers excluded an African-American peer; Condition 2) Interracial: African-American peers excluded a European-American peer; Condition 3) Same Race: matched to the race of the participant.

