
FIGURE 1.
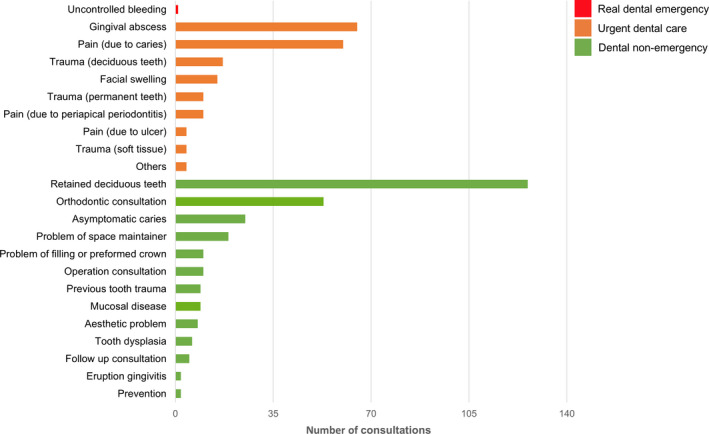
Distribution of number of real dental emergency, urgent dental care, and dental non‐emergency (N = 474)[Colour figure can be viewed at wileyonlinelibrary.com]
Official websites use .gov
A
.gov website belongs to an official
government organization in the United States.
Secure .gov websites use HTTPS
A lock (
) or https:// means you've safely
connected to the .gov website. Share sensitive
information only on official, secure websites.
Distribution of number of real dental emergency, urgent dental care, and dental non‐emergency (N = 474)[Colour figure can be viewed at wileyonlinelibrary.com]