Figure 2.

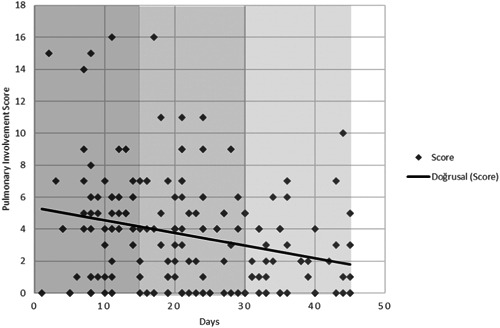
Scatter diagram showing the gradual decrease in the lung involvement score on patients' CT scans throughout the 45 days of study. CT, computed tomography

Scatter diagram showing the gradual decrease in the lung involvement score on patients' CT scans throughout the 45 days of study. CT, computed tomography