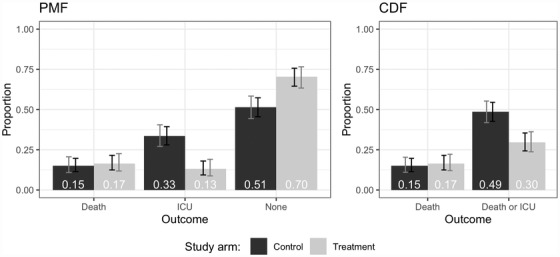
FIGURE 1.

Example figures illustrating covariate‐adjusted estimates of the PMF and CDF by study arm with pointwise (black) and simultaneous (gray) confidence intervals. “ICU” represents survival and ICU admission; “None” represents survival and no ICU admission
