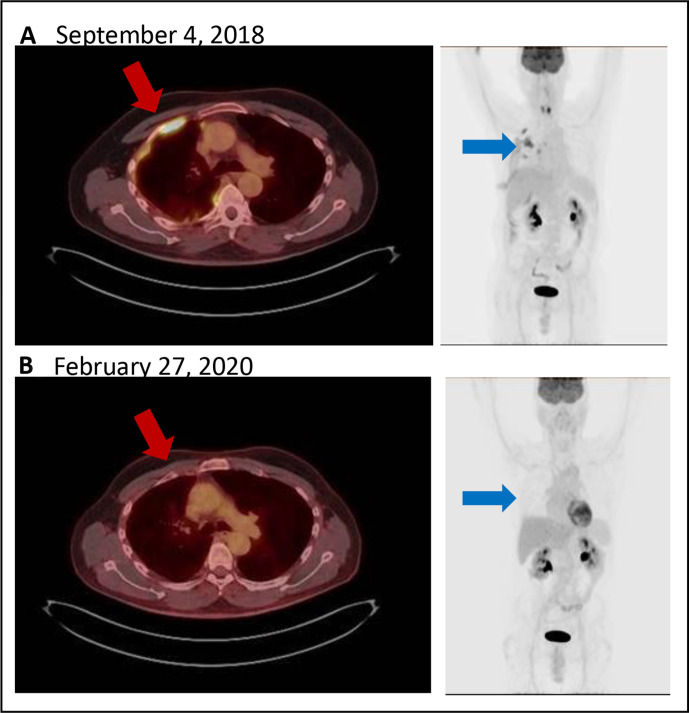
Figure 3.
(A) Positron emission tomography/computed tomography (PET/CT) (left) demonstrates hypermetabolic lesion in the pleura of the right anterior rib space (red arrow). Maximum intensity projection (MIP, right) with multifocal lesions (blue arrow). (B) Follow-up PET/CT (left) and MIP (right) with complete metabolic response.

