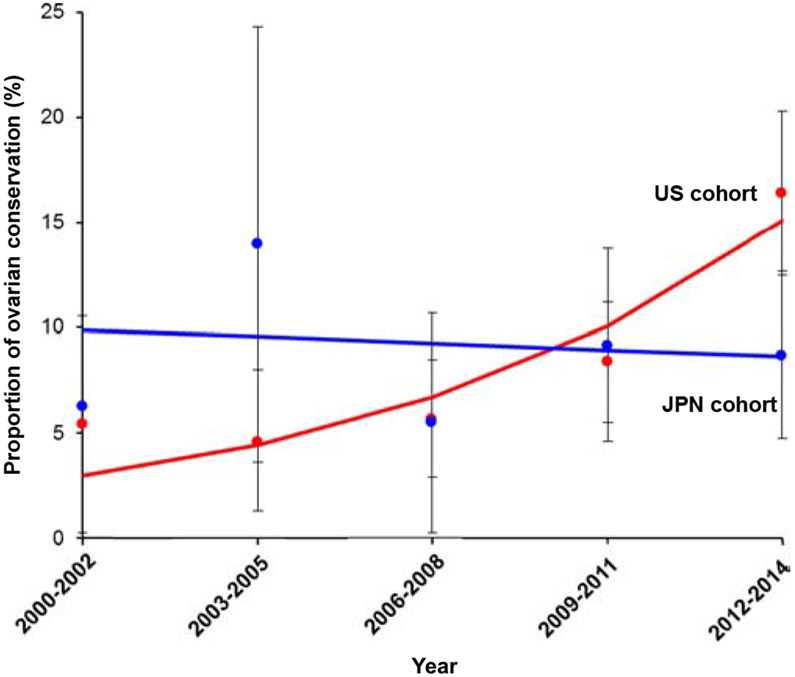
Fig. 1.
Trends of ovarian conservation at hysterectomy. Proportion of women who had ovarian conservation at hysterectomy is shown over time for the US cohort (red color, P = 0.020) and the Japan cohort (blue color, P = 0.787). Solid lines represent the modeled value. Dots represent the observed values. Bars represent 95% confidence interval. (For interpretation of the references to color in this figure legend, the reader is referred to the web version of this article.)

