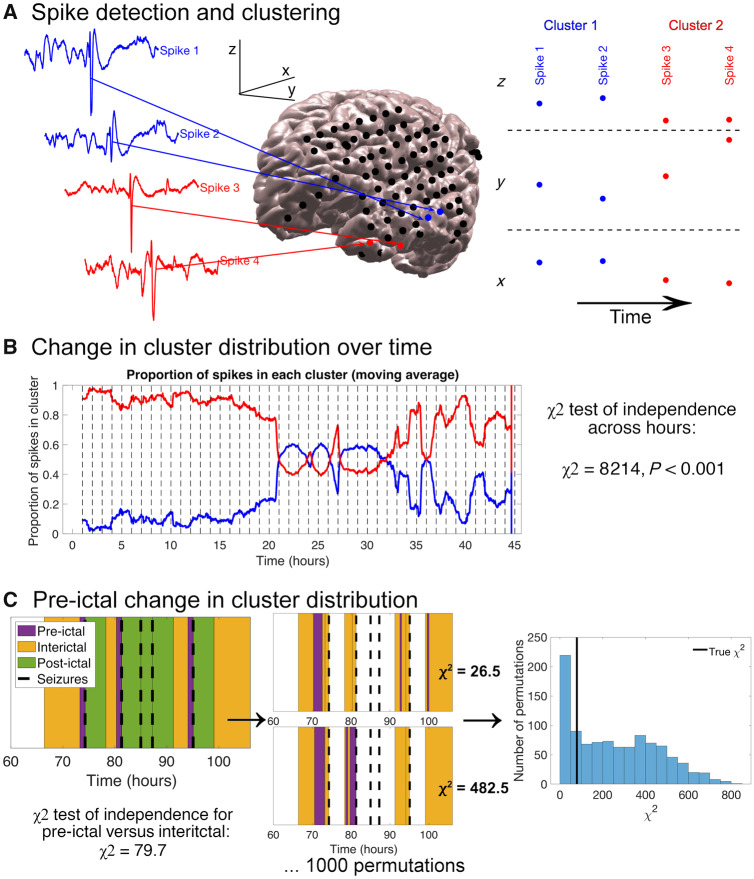
Figure 1.
Methods for spike detection and spatial clustering, determining change in cluster distribution over time, and determining pre-ictal change in cluster distribution. All data shown are for Patient HUP078. (A) Examples of four spike detections, the electrodes where they were detected, and electrode x, y and z coordinates. Two clusters (labelled red and blue) were identified. (B) Algorithm for determining the change in spike cluster distribution over time. The EEG recording was divided into hour-long bins (vertical dotted lines in the plot). The number of spikes in each cluster was compared across hour-long bins using a χ2 test for independence. (C) Algorithm for determining the pre-ictal change in cluster distribution. The number of spikes in each cluster was compared between the pre-ictal and interictal time periods with a χ2 independence test. Seizures occurring during the ‘postictal’ period—within 4 h—of a preceding seizure were defined to have no ‘pre-ictal’ period, as was the case for the third and fourth seizure shown above. We then computed 1000 random permutations of pre-ictal start times. The pre-ictal period durations varied across permutations so as to keep the number of spikes constant. We obtained a new pre-ictal versus interictal chi-squared statistic for each permutation. The true χ2 statistic was compared to the distribution of χ2 statistics from the permutations to determine there was a significant difference between the pre-ictal and interictal cluster distributions. In the example above, 706/1000 random permutations had larger χ2 statistics than the true χ2 statistic, yielding a P-value of 0.71.

